Environment
Climate Change
Policies and Basic Approach
How we respond to climate change and increasingly frequent and severe natural disasters – whether through initiatives such as the United Nations' Sustainable Development Goals (SDGs), the ratification of the Paris Agreement at the United Nations, or other initiatives – is one of the most pressing issues of our time. Businesses must also play their part, and it is becoming increasingly important for companies to act responsibly to support the creation of a sustainable society.
The material issues ("Materiality") identified by Mitsui & Co. include "Establish a foundation for sustainable and stable supply," and "Create a community coexisting with nature." Furthermore, our Environmental Policy stipulates that we will pursue the kinds of business that will help us act to reduce greenhouse gas (GHG) emissions, as well as mitigate and adapt to climate change. We have positioned climate change as one of the key themes of our sustainability management in our Medium-term Management Plan 2026, and continuing from our previous Medium-term Management Plan, we will work to transform our business portfolio with the aim of achieving a decarbonized society. Moreover, we position technological innovation in environment and clean tech as one of the core strategic fields, and are working to pursue and expand investment opportunities.
We have set targets that aim to contribute to the goals of the Paris Agreement and Japan's own medium- to long-term GHG emission reduction targets. Through our global and wide-ranging business activities, we will help to develop economies and communities in many countries and regions across the world and contribute to solving the global challenges we face, such as mitigating and adapting to climate change.
At a business briefings held on March 14, 2025, Mitsui presented the status of our efforts to address climate change as progress in our sustainability management. Please refer to the link below for more information.
Mitsui & Co. Business briefings: Sustainability Management-Climate Change and Natural Capital-
Disclosure Based on TCFD Recommendations
Disclosure Policy
In December 2018, Mitsui declared its support for the Task Force on Climate-related Financial Disclosures (TCFD). In accordance with the TCFD recommendations and as a responsible company operating globally, we actively promote information disclosure with an awareness of stakeholder demands.
Disclosure Based on TCFD Recommendations (December 2025) (PDF 1.47MB)
Governance
Governance Structure for Climate Change Response
We have positioned addressing climate change as a key management issue. Basic management policy, business activities, and corporate policies and strategies that concern climate change are planned and developed, and advised on by the Sustainability Committee, an organization under the Executive Committee. The Sustainability Committee is structured so that its activities are appropriately supervised by the Board of Directors, and matters deliberated on by the Sustainability Committee are regularly discussed and reported to the Executive Committee and the Board of Directors meetings. During the fiscal year ended March 31, 2025, agenda items related to the Company's response to climate change were discussed and reported on at Board of Directors meetings. These items included sustainability promotion results, plans, and activity, response to sustainability disclosure requirements, the evaluation method for remuneration of Directors and Audit & Supervisory Board Members, and the medium-term management plan. In addition, board members, including Directors, Audit & Supervisory Board Members, and External Members, held free discussions on the theme of climate change response, creating a forum for active discussion on the topic.
| Officers in Charge of Business Units | Representative Director, Executive Vice President, Chief Strategy Officer (CSO), Chair of the Sustainability Committee |
|---|---|
| Administrative Office | Corporate Sustainability Div., Corporate Planning & Strategy Div. |
Please refer to the links below for more information on Mitsui's Sustainability Management Framework and the activities of the Sustainability Committee.

Climate Change-related Discussions
There were 22 major climate change-related discussions by the Sustainability Committee over the past three years.

- Report on expanding climate change disclosures under the TCFD
- Deliberations on ESG-linked officers' remuneration/climate change assessment items
- Report on the external environment and the challenges Facing Mitsui & Co. in relation to climate
- Report on progress with Scope 3 and scenario analyses
- Report on materials of the Investor Day "Path to Green Transformation" presentation
- Free discussion and deliberations on updating and further utilizing internal carbon pricing system

- Report and free discussion on the business plan for FY March 2024 summary and issues related to climate
- Report on enhancing climate change-related disclosures (Scope 3 Emission/Reduction Contribution/Transition Risk/Physical Risk)
- Deliberations on performance-linked restricted stock-based remuneration/climate change assessment items (twice)
- Free discussion on Scope 1 and 2, and Scope 3 Category 15 reductions
- Report and free discussion on climate change/Scope 3 emission preliminary calculation results and future policies
- Report on enhancing disclosures based on TCFD recommendations (Transition Risk/Physical Risk)
- Report on climate change targets and Scope 3 emissions
- Report on Investor Day - outline of materials for the climate change part
- Deliberations on updating internal carbon pricing system

- Report and discussion on business plan progress toward climate change targets (Scope 1 and 2, and Scope 3 Category 15)
- Discussion on climate-related targets
- Report on progress in sustainability information disclosure
- Report on the status of consideration and response policy regarding the International Sustainability Standards Board (ISSB)
- Report on progress toward halving Scope 1 and 2 emissions of non-consolidated/consolidated subsidiaries
- Deliberation and report on the update and utilization of internal carbon pricing system
- Deliberation and discussion (three times) on climate-related evaluation items in the performance-linked restricted stock-based remuneration plan
Sustainability Advisory Board (SAB)/Collaboration with External Experts
We have established SAB, a group comprising external experts on societal and environmental topics such as climate change. The Sustainability Committee uses information and advice from SAB members in their deliberations. In addition to Sustainability Advisory Board members, we also communicate with external experts to help ensure that we address climate change appropriately.
Please refer to the links below for more information on Mitsui's Sustainability Management Framework and the activities of the Sustainability Committee.
- Our Approach to Sustainability and Management Framework: Sustainability Governance and Oversight
- Our Approach to Sustainability and Management Framework: Sustainability Committee Details
- Our Approach to Sustainability and Management Framework: Sustainability Advisory Board (SAB)
Reflecting Climate Change Responses in the Remuneration of Directors and Audit & Supervisory Board Members Plan
The company decided to introduce a new performance-linked restricted stock-based remuneration plan from the fiscal year ended March 2023, which was approved at the General Meeting of Shareholders on June 22, 2022. The remuneration plan has been introduced to incentivize the company to fulfill our social responsibilities and to continuously improve our medium- to long-term performance and corporate value. As one of the management evaluation indicators, sustainability elements, including our response to climate change, are included. For more information, please see "4. Corporate Information, 4. Corporate Governance, (4) Remuneration of Directors and Audit & Supervisory Board Members" in the Annual Securities Report for the fiscal year ended March 31, 2025.
Annual Securities Report for the fiscal year ended March 31, 2025 (PDF 13.1MB)
Strategy
Scenario Analysis Policy and Process
Since declaring our support for the TCFD recommendations in December 2018, we have been engaged in a step-by-step scenario analysis process to enhance the resilience of our strategy by responding flexibly to changes in the global business environment. Traditionally, business units have analyzed risks, countermeasures, quantitative impact, etc., for their selected businesses and discussed them at Sustainability Committee meetings; however, in response to its growing importance, we have integrated scenario analysis into the formulation process for the business plan starting the fiscal year ended March 31, 2023. By incorporating scenario analysis into the business planning process, which is approved by the Board of Directors after reporting and deliberation by the Executive Committee, the results of scenario analysis are confirmed and deliberated by management and reflected in the business plan and business portfolio strategy.
Selected Scenarios
We are conducting scenario analysis in short- (0-1 year), medium- (1-10 years), and long-term (10-30 years) timeframes up to the year 2050. We conduct scenario analysis of transition risks*1 and opportunities with reference to the scenarios set out in the World Energy Outlook (WEO) published by the International Energy Agency (IEA). Regarding physical risks*2 , we utilizes external advisors and analyzes each future risk item (as of 2030 and 2050) for invested assets with high physical risk impact with reference to the Representative Concentration Pathway (RCP) used by the Intergovernmental Panel on Climate Change (IPCC).
*1 "Transition risks" refer to risks caused by changes in policy/legal regulations, technology development, market trends, market evaluation, etc.
*2 "Physical risks" refer to the risk of physical damage caused by increases in natural disasters and abnormal weather arising from climate change.
- IEA Stated Policies Scenario (STEPS): Scenario that reflects the current policy targets of each country
- IEA Announced Pledges Scenario (APS): Scenario that assumes the government's announced pledges are implemented
- IEA Net-Zero Emissions by 2050 Scenario (NZE): Scenario for achieving the target of limiting global warming to less than 1.5°C compared to pre-Industrial Revolution levels
- IPCC RCP 8.5 Scenario: Scenario in which the world's average temperature rises by around 4.0°C by 2100
Major Risks and Opportunities Associated with Climate Change
Mitsui is engaged in a wide range of businesses in countries and regions around the world, and we view the diverse risks and opportunities presented by climate change as important factors that we must consider when formulating our business strategies. We are identifying the short-, medium-, and long-term risks and opportunities that accompany climate change, and we review them periodically. We also review each segment in response to changes in the macroenvironment and trends, and adjustments in our business portfolio, along with other changes in the internal and external environment, and reflect them in our business strategy in a timely manner. In our Medium-term Management Plan 2026, we have positioned "Deeper Sustainability Management" as one of our Corporate Strategies. Additionally, we have designated "Global Energy Transition" as one of our Key Strategic Initiatives, aiming to provide practical solutions through our business activities from the dual perspectives of stable energy supply and climate change response. From a financial planning standpoint, the Medium-term Management Plan 2026 includes a cash flow allocation outlook based on the premise of maintaining positive post-shareholder-return cash flow. According to the latest outlook as of May 2025, we expect to allocate a cumulative total of 2.3 trillion yen to growth investments over the three-year period of the Medium-term Management Plan. Of this amount, 600 billion yen is earmarked for the "Global Energy Transition" initiative, and we will continue to advance efforts aligned with our transition plan.
| Transition Risks | Policy and Legal Risks |
|
|---|---|---|
| Technology Risks |
|
|
| Market Risks |
|
|
| Physical Risks | Acute Risks |
|
| Chronic Risks |
|
Further, for each of our segments we have analyzed the internal and external environment and identified risks and opportunities.
| Segment | Risks | Opportunities |
|---|---|---|
| Mineral & Metal Resources |
|
|
| Energy |
|
|
| Machinery & Infrastructure |
|
|
| Chemicals |
|
|
| Iron & Steel Products |
|
|
| Lifestyle |
|
|
| Innovation & Corporate Development |
|
|
*CCS: Carbon Capture and Storage
CCUS: Carbon Capture, Utilization and Storage
Transition Risk Assessments
We use multiple climate change scenarios for the selected business to assess the impact of transition risks on financial planning and business strategies, and apply the results to investigate necessary countermeasures.
Selection of Business for Scenario Analyses
Taking the scale of business operations and climate change impact into account, upon categorizing businesses as "high," "medium," or "low" priority, we have selected "high" priority business areas as targets for scenario analyses.

Results of Scenario Analysis
The results of scenario analysis for the ten businesses selected for this study are shown below. The scenarios referred to in the scenario analysis are organized into Current Policies and Transition Scenarios as follows.
- Current Policies Scenario: A scenario in which the current climate-related initiatives of each country are maintained, demand (mainly in emerging countries) for fossil fuels and other resources that emit GHGs remains to a certain extent, and business practices that could impact climate change continue (STEPS, etc.).
- Transition Scenario: A scenario in which there is a slowdown in demand for fossil fuels and other resources that emit GHGs, and a rapid increase in demand for renewable energy and other resources, as a result of the international development of advanced initiatives and systems to address climate change as well as a shift towards energy saving and electrification driven by widespread decarbonization and technological innovation (APS, NZE, etc.).
The impact of the Current Policies Scenario and the Transition Scenarios on the selected businesses from the present day to 2050 is shown in the following three levels. In addition, for the Upstream Oil and Gas Business and LNG Business, Metallurgical Coal Business, and Thermal Power Generation Business, which we have judged to be particularly important in terms of scale of business operations and climate change impact, we have analyzed the impact on net income for the fiscal years ending March 2030, 2040, and 2050. We have then presented them in three levels based on our assumed base case, taking into account our understanding of the business environment and various scenarios. The analysis is based on our internal carbon pricing system.
Internal Carbon Pricing System
Impacts on the Selected Businesses
 : Positive impact on business
 : No change or slight impact on business
 : Negative impact on business
Quantitative Impact on the Selected Businesses
Large: -USD 300 million or more but less than -USD 500 million
Medium: -USD 100million or more but less than -USD 300 million
Small: - less than USD 100 million
Upstream Oil and Gas Business and LNG Business
Please scroll horizontally to look at table below.
| Awareness of the Business Environment Under Each Scenario | Impact on Businesses Based on Awareness of the Business Environment | Countermeasures | ||
|---|---|---|---|---|
| Current Policies Scenario (STEPS, etc.) Growth in oil demand is expected to gradually slow, with demand peaking in the mid-2030s and then leveling off toward 2050. Demand for natural gas is expected to grow steadily for the power and industrial sectors in emerging Asian countries, centered on China and India. Transition Scenario (2°C equivalent/APS, etc.) Oil demand is expected to decline by half through to 2050 amid progress towards decarbonization, mainly through electrification of the transportation sector in developed countries. Demand for natural gas is expected to remain firm for the next five to ten years as a substitute for coal-fired power generation. By 2050, however, demand is expected to decline to about two-thirds, centered on the power generation sector, due to the spread of renewable energies. Meanwhile, new demand for hydrogen feedstock and other applications is expected to grow over the long term. Transition Scenario (1.5°C/NZE, etc.) Although global demand for natural gas is expected to gradually decline after 2025 and halve between 2030 and 2050, its importance as a raw material for hydrogen is expected to rise together with the global trend toward decarbonization. Meanwhile, oil demand is expected to decline sharply after 2030, falling to about a quarter of current demand by 2050. |
Current Policies Scenario (STEPS, etc.) |
Transition Scenario (2°C equivalent/APS, etc.) |
Transition Scenario (1.5°C/NZE, etc.) |
In our Energy segment, we are promoting continued efforts in the energy supply business, focusing on gas and LNG businesses with relatively low GHG emissions for the purpose of providing a stable supply base for sustainable growth around the world. Accordingly, to enhance our risk resilience to sudden changes in supply and demand trends, we will continue to work on improving asset value, including strengthening the competitiveness of existing business assets, reducing GHG emissions, and decarbonization initiatives, while considering the global energy and geopolitical situation. Particularly for new projects, we will carefully select highly competitive projects, taking into account potential future carbon costs including policy changes and the introduction of carbon taxes in each country, and build a well-balanced portfolio of business assets, including implementing timely asset recycling. While helping to decarbonize the entire value chain, we will continue to work on upstream development of natural gas, which is a transition energy source and can be used as a feedstock for next-generation fuels, and to increase our liquefaction capacity. Utilizing our upstream business expertise, while paying attention to technological development trends and regulatory reforms in each country, we aim to realize the early commercialization of our CCS/CCUS business and geothermal business, along with our ammonia business, leveraging our gas upstream assets and our existing customer network. |
| While faced with the dual challenge of needing to expand quantity and improve quality, renewable energy will steadily expand, and fossil fuels will remain indispensable as a primary energy source for the time being. Although oil demand is expected to peak and then remain flat or decline in all scenarios, the impact is limited due to the expected increase in the ratio of gas production in our overall crude oil and gas equity share of production in the future. Natural gas is an important transition energy source with relatively low environmental impact and a realistic solution to meet growing demand while addressing climate change challenges. Although we expect strong demand for LNG/natural gas particularly in Asia in the medium term under both Transition Scenarios, there is a risk that the value of upstream assets will be impacted if demand declines under the Transition Scenario (1.5°C). Therefore, ongoing verification and monitoring of demand trends and their effect on our business is necessary. | ||||
Please scroll horizontally to look at table below.
| Impact on net income and assumptions in Transition Scenarios | |||||
|---|---|---|---|---|---|
| 2°C equivalent/APS, etc. | 1.5°C/NZE, etc. | ||||
| FY March 2030 Small |
FY March 2040 Small |
FY March 2050 Small |
FY March 2030 Large |
FY March 2040 Large |
FY March 2050 Medium |
| In our analysis of the Transition Scenarios in the Upstream Oil and Gas Business and LNG Business, we assume that the supply-demand balance will be reflected in commodity prices over the medium to long term due to the highly marketable nature of the commodities. Furthermore, we analyze our assets with reference to the IEA World Energy Outlook (APS scenario/NZE scenario) and other market outlooks, with a focus on the downward resilience of our assets to commodity prices. In this analysis, we assume that we will continue to hold our assets until the end of production, since the main purpose of this analysis is to assess the impact on our existing business. |
|||||
Metallurgical Coal Business
Please scroll horizontally to look at table below.
| Awareness of the Business Environment Under Each Scenario | Impact on Businesses Based on Awareness of the Business Environment | Countermeasures | ||
|---|---|---|---|---|
| Current Policies Scenario (STEPS, etc.) In developed countries, demand is expected to gradually decline from the 2030s against a backdrop of declining crude steel production and lower blast furnace ratios due to the utilization of ferrous scrap, while demand in India and Southeast Asia is expected to grow from the late 2020s onward due to the addition of blast furnaces in the region. Global demand for metallurgical coal is expected to increase moderately from current levels through to 2050. The supply of metallurgical coal is expected to remain flat over the medium to long term as increases in new projects and other factors will be offset by the closure of existing mines, resulting in a tightening of the supply-demand balance. Transition Scenario (2°C equivalent/APS, etc.) Demand for metallurgical coal is expected to remain flat over the medium to long term and remain at current levels in 2050, due to further acceleration in the use of ferrous scrap and alternative raw materials in developed countries, as also expected in the Current Policies Scenario. On the supply side, countries are stepping up their efforts to address climate change, making it more difficult to obtain development permits and financing for new projects or expansion plans. As a result, supply is expected to decrease, and the supply-demand balance may become even tighter. Transition Scenario (1.5°C/NZE, etc.) Greater demand for decarbonization is expected to drive a shift towards more efficient use of steel, and both crude steel production and metallurgical coal demand are expected to decline further compared to the other scenarios. New projects or expansion plans may be more difficult to implement under the Transition Scenario (1.5°C), resulting in a decline in supply and a further tightening of the supply-demand balance. |
Current Policies Scenario (STEPS, etc.) |
Transition Scenario (2°C equivalent/APS, etc.) |
Transition Scenario (1.5°C/NZE, etc.) |
As demand for metallurgical coal is expected to remain strong over the medium to long term, we will strive to improve the quality of our assets while maintaining stable supplies to customers. We will closely monitor changes in the external environment, and strengthen our efforts, such as utilizing the methane gas produced and shifting to alternative fuels and raw materials, with a view to realizing a decarbonized society together with our business partners. |
| Under the Current Policies Scenario, demand for metallurgical coal is expected to remain flat or increase slightly, and the competitiveness of our assets will be maintained; therefore, business profitability is likely to remain strong. Under the Transition Scenarios (2°C equivalent/APS, etc., 1.5°C/NZE, etc.), new projects and expansion plans are expected to slow down on the supply side in response to declining demand, resulting in a decline in the volume of supplies. Although our assets will remain competitive, we expect cost increases in relation to the introduction of emission reduction technology, environmental compliance, and financing. Continuous close attention must be paid to the business impact that these costs have on metallurgical coal prices, along with the business impact of policies and policy trends in each country. Additionally, we are no longer adding to our assets that only produce thermal coal. We do not hold any thermal coal mine interests in the coal business. Our policy is not to acquire any new interests in thermal coal mines. |
||||
Please scroll horizontally to look at table below.
| Impact on net income and assumptions in Transition Scenarios | |||||
|---|---|---|---|---|---|
| 2°C equivalent/APS, etc. | 1.5°C/NZE, etc. | ||||
| FY March 2030 Large |
FY March 2040 Small |
FY March 2050 Small |
FY March 2030 Large |
FY March 2040 Small |
FY March 2050 Small |
| In our analysis of the Transition Scenarios in the Metallurgical Coal Business, supply, demand, and commodity prices of steelmaking raw materials are analyzed with reference to the IEA World Energy Outlook (APS scenario/NZE scenario) and other outlooks, as well as trends toward carbon neutrality by consumers. The analysis also takes into account the carbon cost of GHG emissions from the business. Since the main purpose of this analysis is to determine the impact on the existing business, we have assumed that the existing business will continue to be held until the end of mining operations. |
|||||
Thermal Power Generation Business
Please scroll horizontally to look at table below.
| Awareness of the Business Environment Under Each Scenario | Impact on Businesses Based on Awareness of the Business Environment | Countermeasures | ||
|---|---|---|---|---|
| Current Policies Scenario (STEPS, etc.) Fossil fuel-based power generation will gradually decline over the long term, particularly in developed countries. Meanwhile, demand for new power plants is expected to continue in the medium term in some emerging countries where electricity demand will continue to grow and where renewable energy alone is not sufficient to meet supply needs. Transition Scenario (2°C equivalent/APS, etc.) Fossil fuel-based power generation is expected to decline at a faster rate in the medium to long term than under the Current Policies Scenario, particularly in developed countries. Although developed countries are shifting to renewable energy sources, a certain amount of coal-fired power generation demand is expected in emerging countries even as late as 2050. In addition, demand for gas-fired power generation as a transition energy source is expected to continue over the medium to long term in both developed and emerging countries. Transition Scenario (1.5°C/NZE, etc.) Electricity demand is expected to increase significantly in the medium to long term against the backdrop of rapid progress in decarbonization trends, with demand increasing by 50% in 2050 compared to the Current Policies Scenario. Compared to the 2°C equivalent/APS, etc. scenario, fossil fuel-based electricity generation is expected to decline at a faster rate, and by 2050, power plants with decarbonization facilities such as CCUS will become mainstream. The share of renewable energy is expected to further increase, with renewable energy, mainly wind and solar, supplying the majority of electricity demand. |
Current Policies Scenario (STEPS, etc.) |
Transition Scenario (2°C equivalent/APS, etc.) |
Transition Scenario (1.5°C/NZE, etc.) |
We intend to take the following actions to improve our power generation business portfolio in accordance with changes in the environment surrounding the power business domain. Coal-fired power projects: We will not invest in any new projects. We are studying plans to exit from our remaining coal-fired power assets* by 2040. We take into account the responsibility of the current owners to address the impact on local communities of power purchase agreements which will continue into the 2040s, and to ensure appropriate returns for our shareholders, as preconditions for proceeding with exit. Gas-fired power projects: We will examine the significance of holding each asset while fulfilling our responsibility as an operator to ensure a stable supply of electricity. When we consider participating new gas-fired power projects, we will take into account the need for gas-fired power as a transition energy source such as the power supply mix and electricity demand outlook for each region, as well as potential future carbon costs. * Remaining coal-fired power assets: Malaysia and Morocco |
| The impact of changes in the external environment on our existing business is limited, as most of our power generation business portfolio is based on long-term power purchase agreements—in which consideration is paid for the generation capacity rather than for generated volume. However, under the Transition Scenarios, the global trend towards decarbonization will rapidly accelerate, which may affect the business viability of some assets after power purchase agreements expire, and therefore ongoing verification and monitoring of stranded-asset risks is required. |
||||
Please scroll horizontally to look at table below.
| Impact on net income and assumptions in Transition Scenarios | |||||
|---|---|---|---|---|---|
| 2°C equivalent/APS, etc. | 1.5°C/NZE, etc. | ||||
| FY March 2030 Small |
FY March 2040 Small |
FY March 2050 Small |
FY March 2030 Small |
FY March 2040 Small |
FY March 2050 Small |
| In analyzing the Transition Risk Scenarios, we calculate the impact by assuming that carbon costs will be passed on to off-takers in accordance with the PPA provisions during the terms of long-term power purchase agreements (PPA), and that we will review our holding policy for assets that remain in the red after the PPA ends and carbon costs are reflected. In addition, the sale of some assets based on the recycling strategy for thermal power generation assets is also factored into the analysis. | |||||
Iron Ore Business
Please scroll horizontally to look at table below.
| Awareness of the Business Environment Under Each Scenario | Impact on Businesses | Countermeasures | ||
|---|---|---|---|---|
| Current Policies Scenario (STEPS, etc.) Although crude steel production in China, the world's largest producer, is expected to decline in the future, this is expected to be offset by increased production in India and Southeast Asia. We predict that global crude steel production will remain steady over the medium to long term. Transition Scenario (2°C equivalent/APS, etc.) With higher rates of use of electric furnaces, and an increase in production of direct reduced iron, which mainly uses high-grade ore, we expect an increase in demand for high-grade ore, and a corresponding increase in premiums and discounts for high-grade ore/low-grade ore. Transition Scenario (1.5°C/NZE, etc.) In response to the growing demand for a shift to low carbon, the use of scrap iron and direct reduced iron is expected to further expand, and crude steel production itself is expected to decrease due to more efficient steel use. Iron ore demand is expected to shrink compared to the Transition Scenario (2°C equivalent/APS, etc.). |
Current Policies Scenario (STEPS, etc.) |
Transition Scenario (2°C equivalent/APS, etc.) |
Transition Scenario (1.5°C/NZE, etc.) |
For the foreseeable future, we will work to strengthen the competitiveness of our assets while providing stable iron ore supplies to customers, and continue to closely monitor the rate at which electric furnace production methods spread as a means of realizing a decarbonized steel industry, and the speed of change regarding new steelmaking technologies. In addition, we will strengthen efforts towards realizing a decarbonized society together with our business partners, while closely monitoring changes in the external environment. |
| Although peak-out in China in the mid-2020s is expected to affect crude steel production, India and Southeast Asia should offset the decline in China. Crude steel production and iron ore demand are expected to remain steady over the medium to long term under both the Current Policies and Transition Scenario (2°C equivalent/APS, etc.). Under the Transition Scenario (1.5°C/NZE, etc.), iron ore demand is expected to decline relative to other scenarios. The Transition Scenario (2°C equivalent/APS, etc.) incorporates an increase in premiums and discounts for high-grade and low-grade ore, but the impact on overall revenue will be limited. A similar trend is expected under the Transition Scenario (1.5°C/NZE, etc.); however, we foresee downward pressure on iron ore prices and profitability due to lower demand. The business impact of policies and policy trends in each country will need to be continuously examined. |
||||
Offshore Oil and Gas Production Facilities Business
Please scroll horizontally to look at table below.
| Awareness of the Business Environment Under Each Scenario | Impact on Businesses | Countermeasures | ||
|---|---|---|---|---|
| Current Policies Scenario (STEPS, etc.) Demand for new production facilities will decline over the medium to long term in line with a slowdown in oil demand growth; however, the timeline of this will differ by region. Transition Scenario (2°C equivalent/APS, etc.) Oil demand will decline earlier than under the Current Policies Scenario due to the promotion of electrification in developed countries, dropping by half through to 2050. As a result, demand for new production facilities is expected to fall faster than under the Current Policies Scenario. Transition Scenario (1.5°C/NZE, etc.) Oil demand is expected to decline sharply after 2030, and fall to about a quarter of the current level by 2050. With the rapid decline in demand, crude oil prices are expected to fall to about half by 2030 and one-quarter by 2050, compared to the Current Policies Scenario. As a result, demand for new production facilities is expected to decline more than under the Transition Scenario (2°C equivalent/APS, etc.). |
Current Policies Scenario (STEPS, etc.) |
Transition Scenario (2°C equivalent/APS, etc.) |
Transition Scenario (1.5°C/NZE, etc.) |
Considering the scenario of declining demand in the medium to long term, we will work to transform our businesses into a field where we can utilize the expertise we have accumulated from our existing business (e.g., floating offshore wind power). |
| Many of our projects related to offshore crude oil and gas production facilities, such as Floating Production, Storage and Offloading (FPSO) facilities and drillships, that continue beyond 2030, are based on committed long-term use by customers under long-term contracts. Therefore, the impact of the Current Policies and Transition Scenarios on existing businesses is expected to be limited. However, under the Transition Scenario (1.5°C/NZE, etc.), a significant decline in oil demand and crude oil prices beyond 2030 may impact the continuity of production activities of energy companies, and will require continuous verification and monitoring of the impact on business. | ||||
Gas Distribution Business
Please scroll horizontally to look at table below.
| Awareness of the Business Environment Under Each Scenario | Impact on Businesses | Countermeasures | ||
|---|---|---|---|---|
| Current Policies Scenario (STEPS, etc.) Natural gas demand is expected to increase steadily in line with rising demand for gas in emerging countries. Transition Scenario (2°C equivalent/APS, etc.) Demand for natural gas is expected to remain firm for the next five to ten years due to its use as a substitute for coal-fired power generation. However, through to 2050, demand is expected to fall to about two-thirds, with the majority of this reduction in the power generation sector, due to the spread of renewable energy. In emerging countries, gas demand is expected to increase, but grow at a slower pace than under the Current Policies Scenario. Transition Scenario (1.5°C/NZE, etc.) Global demand for natural gas is expected to gradually decline after 2025 and halve from 2030 to 2050. Oil demand is also expected to drop sharply after 2030, falling to about a quarter of current demand by 2050. |
Current Policies Scenario (STEPS, etc.) |
Transition Scenario (2°C equivalent/APS, etc.) |
Transition Scenario (1.5°C/NZE, etc.) |
We will continue to work on improving asset value, including decarbonization initiatives such as biogas utilization and GHG emissions reduction. For new projects, we are working in consideration of potential future carbon costs. |
| Our gas distribution businesses located in emerging countries are granted exclusive long-term concession rights in each of the concession areas. Under the Current Policies and Transition Scenarios (2°C equivalent/APS), in which gas demand in emerging countries is expected to increase in the medium to long term, the impact on existing businesses is expected to be limited. Under the Transition Scenario (1.5°C/NZE, etc.), demand for gas is expected to decline in emerging countries due to a decrease in associated gas production resulting from a decline in oil production, and a rapid rise in the share of renewable energy in the power generation sector, potentially impacting business revenues due to lower gas distribution volumes. | ||||
LNG Shipping Business
Please scroll horizontally to look at table below.
| Awareness of the Business Environment Under Each Scenario | Impact on Businesses | Countermeasures | ||
|---|---|---|---|---|
| Current Policies Scenario (STEPS, etc.) Demand for natural gas is expected to grow steadily over the long term for use in the power and industrial sectors in emerging Asian countries, so demand for operating LNG ships for natural gas is expected to increase. Transition Scenario (2°C equivalent/APS, etc.) Demand for natural gas is expected to continue in the medium to long term as a substitute for coal-fired power generation, and demand for operating LNG ships is expected to increase through to 2050. Transition Scenario (1.5°C/NZE, etc.) Natural gas demand is expected to decline after the mid-2020s due to global decarbonization, and demand for operating LNG ships is expected to decline through to 2050. |
Current Policies Scenario (STEPS, etc.) |
Transition Scenario (2°C equivalent/APS, etc.) |
Transition Scenario (1.5°C/NZE, etc.) |
With consideration for medium- and long-term supply and demand and price trends, we will strive to maintain and improve the profitability of individual businesses, as well as working to ensure stable and streamlined operations, and at the same time identify and capture growth opportunities in new businesses including next-generation fuel tankers and new fuel carriers. |
| In the LNG shipping business, most of the recent projects have secured earnings based on long-term contracts. Therefore, in all scenarios, the impact on the Company's earnings will be limited in the near term. Natural gas is an important transition energy source for decarbonization, so demand is expected to remain strong in the medium term, particularly in Asia. However, under the Transition Scenario (1.5°C/NZE, etc.), there is a risk that the value of assets will be impacted after the end of long-term chartering, as demand is expected to decline toward 2050; this means the impact on our business requires close monitoring. | ||||
Renewable Energy Business
Please scroll horizontally to look at table below.
| Awareness of the Business Environment Under Each Scenario | Impact on Businesses | Countermeasures | ||
|---|---|---|---|---|
| Current Policies Scenario (STEPS, etc.) Demand is expected to increase substantially over the medium to long term in response to decarbonization trends and energy security. Transition Scenario (2°C equivalent/APS, etc.) Demand is expected to increase substantially at a faster rate than in the Current Policies Scenario. Electrification and other factors, especially in developed countries such as the US and Australia, will drive demand growth, and by 2050, the majority of electricity demand is expected to be met by renewable energy sources. Transition Scenario (1.5°C/NZE, etc.) Rapid progress in the global decarbonization trend is expected to drive the spread of electrification, and electricity demand will rise significantly in the medium to long term, increasing by 50% in 2050 compared to the Current Policies Scenario. The share of renewable energy is expected to further increase compared to the Transition Scenario (2°C equivalent/APS, etc.), with the majority of electricity demand expected to come from renewable energy sources, mainly wind and solar, by 2050. Continued large-scale investments will be required for the promotion of renewable energy, and demand is also expected to rise for power grid reinforcement, storage batteries, demand response, etc., to ensure the stability of power networks in each region. |
Current Policies Scenario (STEPS, etc.) |
Transition Scenario (2°C equivalent/APS, etc.) |
Transition Scenario (1.5°C/NZE, etc.) |
We will work to improve the quality of our power generation business portfolio in response to the changing environment. Specifically, in order to increase the renewable energy ratio in the equity share of power generation capacity to over 30% by 2030, we will engage in large-scale renewable energy business to meet local demand. This will include solar power, onshore wind power, and offshore wind power, as well as local production for local-consumption-type distributed renewable energy business. In addition, in view of the potential for intensified competition among operators, we will aim to capture added value by establishing a renewable energy business cluster, leveraging our comprehensive strengths to engage in adjacent areas including the production and sale of green hydrogen, ammonia, and methanol using renewable energy, clean energy sales, EV infrastructure, and offshore wind power infrastructure. |
| While the renewable energy industry is expected to experience significant growth in demand, competition is becoming increasingly intense as the number of operators in the segment grows. Meanwhile, supply-demand balance adjustment needs are expected to expand in some regions in order to cope with grid instability caused by the rapid increase in the renewable energy ratio. In addition, the energy solutions business utilizing digital technology is also expected to expand. The electric vehicle (EV) market is also expected to grow with the support of government policy in various countries, and demand for clean power is expected to grow. |
||||
Power Generation Businesses (Renewable Energy Business) as of March 31, 2026 (PDF 294KB)
Next-Generation Fuel Business
Please scroll horizontally to look at table below.
| Awareness of the Business Environment Under Each Scenario | Impact on Businesses | Countermeasures | ||
|---|---|---|---|---|
| Current Policies Scenario (STEPS, etc.) Demand for biofuels and other next-generation fuel is expected to keep growing strongly over the medium to long term, mainly as a replacement for fossil fuels. Transition Scenario (2°C equivalent/APS, etc.) Demand for biofuels is expected to escalate in the medium term, and while the growth rate will slow over the long term, demand for biofuels for aviation and shipping applications is expected to keep expanding. Hydrogen and clean ammonia are expected to grow, replacing natural gas in the medium to long term. Transition Scenario (1.5°C/NZE, etc.) Demand for biofuels will grow more than the Transition Scenario (2°C) in the medium term, but will then plateau. However, demand for aviation and shipping applications is expected to grow steadily over the medium to long term. Under the Transition Scenario (1.5°C/NZE, etc.), hydrogen and clean ammonia demand is likely to rise much faster than under the Transition Scenario (2°C equivalent/APS, etc.) through to 2050. |
Current Policies Scenario (STEPS, etc.) |
Transition Scenario (2°C equivalent/APS, etc.) |
Transition Scenario (1.5°C/NZE, etc.) |
In the biofuel business, which is expected to be the center of demand in the medium term, we are working to expand our business by leveraging the technology and expertise of our existing investees after assessing the potential environmental impact. In addition, we are promoting efforts focused hydrogen and clean ammonia, geothermal power generation business, and other areas. We view these as realistic solutions for realizing a decarbonized society, and expect them to be in great demand in the long term. While these areas are likely to become next-generation alternative energy sources, further technological innovation is necessary for full-scale expansion. Accordingly, we have formed a specialized in-house team and are accelerating these efforts. |
| There is a significant expectation that demand for next-generation fuel will grow, and promising next-generation energy technologies are in the development pipeline. Along with the introduction of new government programs, etc., in different countries, we expect further accelerated investment in the development of new technologies and lower costs of producing decarbonized energy, stimulating further growth in demand and creating new business opportunities. | ||||
Forestry Resources Business
Please scroll horizontally to look at table below.
| Awareness of the Business Environment Under Each Scenario | Impact on Businesses | Countermeasures | ||
|---|---|---|---|---|
| Current Policies Scenario (STEPS, etc.) Demand for forestry resources (timber, woodchips, etc.) is expected to grow steadily in line with global population growth and expansion in the housing and paper markets in emerging countries, especially in Asia. Additionally, the value of forestry resources, mainly afforestation timber, is expected to increase due to the tightening of natural forest protection policies and logging regulations in each country. Transition Scenario (2°C equivalent/APS, etc.) As in the Current Policies Scenario, demand for forestry resources such as woodchips, which are used as a raw material for housing materials and paper, is expected to increase steadily. In addition, heightened interest in the CO2 absorption capabilities of forestry resources and their characteristics as renewable natural materials is expected to spur growth in the market for forest-based emissions credits, an increase in the price of emissions credits, and an expansion of the market for high-value-added wood-derived products such as biochemicals. Transition Scenario (1.5°C/NZE, etc.) Carbon prices in developed countries are expected to increase by a factor of 1.5 compared to the Transition Scenario (2°C equivalent/APS, etc.), as CO2 emission reduction initiatives are strengthened, and the market for forest-based emissions credits is expected to expand, emissions credit prices are expected to rise, and the market for wood-based high-value-added products such as biochemicals is expected to expand. |
Current Policies Scenario (STEPS, etc.) |
Transition Scenario (2°C equivalent/APS, etc.) |
Transition Scenario (1.5°C/NZE, etc.) |
We will expand our forestry resources business by accumulating assets based on profitability and risk to serve as a foundation for the creation of environmental value and industrial solutions to social issues. We will aim to maximize the value of forestry resources not only by expanding paper and housing applications and creating emissions credits, but also by developing new needs for timber materials. |
| Under the Current Policies Scenario, an increase in demand is expected for forestry resources, especially timber, as renewable and natural materials that contribute to the response to climate change. Under the Transition Scenario, demand for emissions trading is expected to increase and the price of emissions credits is expected to rise, and biochemicals derived from forestry resources are expected to be effectively utilized, which we see as likely to boost profitability. | ||||
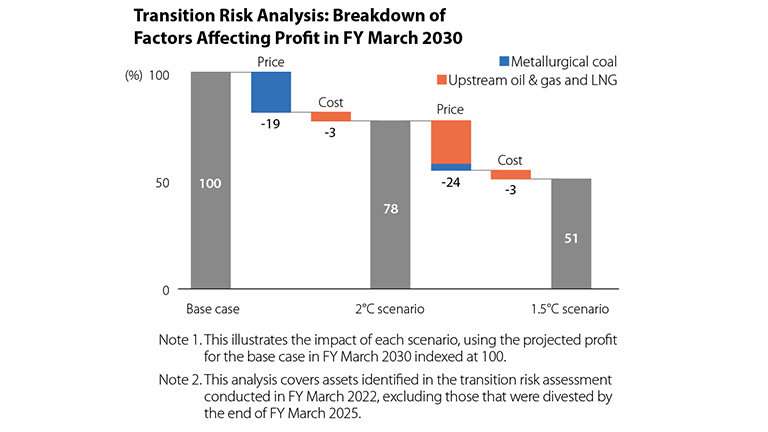
Quantitative Analysis of Transition Risks
We are conducting a quantitative analysis of the impact of climate-related transition risks on target businesses based on the Current Policies Scenario, the 2°C Scenario, and the 1.5°C Scenario. As of fiscal year 2030, we have assessed the impact on current profit under both the 2°C and 1.5°C scenarios, focusing on price and cost factors.
Physical Risk Assessments
We operate a wide range of businesses in various countries and regions, and the manifestation of physical risks may affect them if climate change causes an increase in extreme weather events. Accordingly, when we invest in new businesses, in order to ensure appropriate risk management, we conduct physical risk analysis while taking advice from outside experts as necessary. We also review the effectiveness of countermeasures on-site at each business after making an investment.
In the event that physical risks materialize, while placing the highest priority on protecting human lives, we have established a Business Continuity Management Policy in case of Disasters that takes into consideration coexistence with local communities. We have also taken measures to mitigate and adapt to risks, such as obtaining insurance coverage, securing multiple suppliers, and upgrading our facilities, and will continue to regularly assess the adequacy of our risk management measures. To review the appropriateness of our current risk response, we have utilized an analysis tool developed by ERM, an environmental consulting firm, to evaluate the impact of physical risks on our portfolio companies in the future, as follows.
-
STEP 1
Selection of investments highly impacted by physical risks
-
- Among our portfolio companies, we selected the top 100 companies with the largest investable assets directly impacted by physical risk and the companies with profits of at least 5 billion yen.
- From the selected companies, we considered the overall nature of their business, the degree of geographical diversification of their assets, and other factors, and excluded the companies considered to have a low financial impact from physical risks.
- Finally, we selected 65 companies considered to be highly impacted by physical risks (The total invested assets of the 65 companies is approximately 6 trillion yen as of March 31, 2024).
-
STEP 2
Future risk analysis using an external consulting firm's analysis tool
-
- We have mapped the locations of key assets held by the 65 selected companies.
- We used ERM's physical risk analysis tool to analyze the increase/decrease in physical risk impact in the following cases:
- 2030 and 2050 cross-section
- 4°C scenario - Physical risk hazards analyzed: flooding (extreme rainfall flooding, river flooding, coastal flooding), extreme cold, extreme heat, tropical cyclones, landslides, wildfires, water stress and drought.
-
STEP 3
Review of countermeasures and appropriate actions based on analysis results
-
- Based on the results of the physical risk analysis, we reviewed the countermeasures, including:
- Implementing countermeasures for each risk on a case-by-case basis
- Developing and annually reviewing BCP
- Obtaining insurance coverage, etc. - We minimize the impact of each physical risk on our business by implementing appropriate countermeasures for each business.
- Chronic physical risks are regularly monitored, and countermeasures are implemented according to the situation.
- Based on the results of the physical risk analysis, we reviewed the countermeasures, including:
Analysis Results
The location of the main assets of the selected investments and the physical risks of the 4°C scenario in 2030 are as follows.

Summary of Major Physical Risks Affecting the Company under the 4°C Scenario, and Measures to Address Them
The results of our analysis indicate that the four physical risk hazards that will have a particularly significant impact on the Company in 2030 and 2050 under the 4°C scenario are extreme heat, wildfires, water stress & drought, and tropical cyclones. The number of companies at high risk in 2050 of extreme heat will be approximately 80% of the 65 companies analyzed. With regard to risk of wildfire, water stress/drought, and tropical cyclones, nearly half of the companies analyzed will be at high risk in 2050, and the number of companies at high risk of wildfires will approximately double. Many companies are currently at high risk of tropical cyclones, and although there will only be a small increase in the number of companies at high risk, there is concern that the frequency and magnitude of their occurrence will make damage more severe. For example, if a cyclone were to directly hit port facilities in Western Australia, causing a 20-day operational shutdown and affecting 50% of our participating projects, we estimate a financial impact of approximately 6.5 billion yen per year on our Australian iron ore business. Based on this analysis and similar findings, we will continue to recognize physical risks across our portfolio and implement appropriate measures, such as reviewing business continuity plans and insurance coverage.
A summary of each physical risk hazard and the measures to address them is shown below, with the risk level determined by the number of companies at high physical risk.
- 4 companies or fewer
- 5-14 companies
- 15-24 companies
- 25-34 companies
- 35 companies or more
Please scroll horizontally to look at table below.
| Risk level | Risk overview | Countermeasures | |||
|---|---|---|---|---|---|
| Current | 2030 | 2050 | |||
| Extreme heat |
|
|
|||
| Wildfires |
|
|
|||
| Water stress & drought |
|
|
|||
| Tropical cyclones |
|
|
|||
| Flooding |
|
|
|||
Risk Management
We identify company-wide material risks across organizational boundaries and implement a wide range of initiatives to hedge and control risks. For this purpose, Mitsui has established an integrated risk management system that centrally manages company-wide risks, through the Portfolio Management Committee under the Executive Committee. Under the integrated risk management system, the Corporate Staff Division, which acts as the secretariat, manages risks from a company-wide perspective. Material risks we assume include those related to the environment, society, and governance, such as risks from climate change, compliance, and infectious disease, disasters, terrorism, etc. We position risks regarding climate change (physical and transition) as the same level of importance as business investment, geopolitical, and country risks and are taking corresponding measures.
For details of our risk management structure, please refer to the following page.For Mitsui & Co., which operates in countries and regions around the world, the policies of each country and region related to climate change have a significant impact on the profitability and sustainability of each of our businesses. We use the climate-change scenarios published by the IEA and other organizations when analyzing scenarios involving businesses that have significant impacts. We do so to gain an understanding of business impacts both in terms of risk and opportunity, and when considering investment projects, M&A, and other business decisions, we determine business priorities and take these scenarios into account.
In conducting business, we have put in place a system to ensure we give utmost consideration to the environment and society in projects at all stages, including at the launch of a new business, during operations, and even when withdrawing from the business. Our Sustainability Committee discusses response policies and measures regarding environmental and social risks (including climate-change risk), then reports to the Executive Committee and the Board of Directors, which then applies them following approval.
Metrics & Targets
GHG Reduction Targets
Mitsui has established achieving net-zero emissions as our Vision for 2050, and has set the following interim targets as the pathway to achieving the goal.
- For Scopes 1 and 2, and Scope 3 Category 15 (Investments) of the company and its consolidated subsidiaries (including unincorporated JVs*1):
Halving GHG Impact as of 2030 compared to 34 million t-CO2e in the fiscal year ended March 2020 - For Scopes 1 and 2, and Scope 3 Category 15 (Investments) of the company and its consolidated subsidiaries (including unincorporated JVs*1):
Reducing GHG emissions as of 30% compared to 44 million t-CO2e in the fiscal year ended March 2020*2 - For Scopes 1 and 2 of the company and its consolidated subsidiaries:
Halving GHG emissions as of 2030 compared to 0.8 million t-CO2e in the fiscal year ended March 2020. - The renewable energy ratio of our power generation portfolio:
Raising the ratio of renewable energy to over 30% as of 2030.
*1 Unincorporated JVs = unincorporated joint ventures.
*2 Emissions in the baseline year (the fiscal year ended March 2020) include GHG emissions of 36 million t-CO2e and the 8 million t-CO2e that is expected to increase from the standard operation of the thermal power generation business that has made reached final investment decisions (FID) by the end of March 2020.
GHG Emissions
Mitsui has carried out GHG emissions surveys in Japan since the fiscal year ended March 2006, and overseas since the fiscal year ended March 2009. Previously, we disclosed Scope 1 and 2 GHG emissions under the GHG Protocol*1 control standards*2. Since the fiscal year ended March 2020, we have additionally disclosed Scope 3, Category 15 (indirect emissions associated with investments), which covers emissions from investments in energy, mineral, and metal resources as well as thermal power generation business not included in Scopes 1 and 2, and other affiliated company business areas that fall under Scopes 1 and 2. Furthermore, since the fiscal year ended March 2024, we have expanded disclosure to include all applicable Scope 3 categories. Moreover, we have enhanced the scope of disclosures to promote continuous reviews of our portfolio in response to stakeholders' wishes and in consideration of our risk tolerance to climate change, which also takes into account Mitsui's strategy of using our wide range of business activities to take on the challenge of new opportunities in an agile way. The Ruwais LNG Project in the UAE reached final investment decision status in July 2024, is a low-carbon LNG business that features measures to reduce GHG emissions at the LNG production stage by employing electric motors instead of conventional gas turbines for liquefaction plants and utilizing clean power. Together, they contribute to making a sustainable transition to a decarbonized society in addition to providing a long-term stable earnings base.
*1 The GHG Protocol is a GHG emissions calculation and reporting standard formulated through an initiative led by the World Resources Institute (WRI) and the World Business Council for Sustainable Development (WBCSD).
*2 Coverage: Head Office and branches and offices in Japan, all consolidated subsidiaries (100%), and unincorporated joint ventures.
GHG emission reduction results/outlook
Please scroll horizontally to look at table below.
(Million t-CO2e)
| Targets | Boundary | FY March 2020 (Baseline year) |
FY March 2023 | FY March 2024 | FY March 2025 | FY March 2026 | FY March 2030 | 2050 vision |
|---|---|---|---|---|---|---|---|---|
| Actual | Forecast*1 (Underlined figures are Med.-term targets) |
|||||||
| Halve GHG Impact by 2030 | Scope 1 and 2, and Scope 3 Category 15 (Investments) | 36 | 37 | 34 | 29 | 30 | 31 | Net zero |
| Reduction Contribution, absorption/fixed amount | ▲2 | ▲3 | ▲5 | ▲4 | ▲6 | ▲14 | ||
| GHG Impact | 34 | 34 | 29 | 25 | 24 | 17 | ||
| Progress from baseline year | 100% | 100% | 86% | 74% | 71% | 50% | ||
| Reduce Gross GHG emissions by 30% by 2030 | Scope 1 and 2, and Scope 3 Category 15 (Investments) | 36 | 37 | 34 | 29 | 30 | 31 | Net zero |
| Baseline year emissions*2 | 44 | |||||||
| Progress from baseline year*3 | - | 85% | 78% | 66% | 68% | 70% | ||
| Halve GHG emissions by 2030 | Mitsui and its consolidated Scope1 and 2 | 0.8 | 0.6 | 0.6 | 0.6 | 0.6 | 0.4 | Net zero |
| Progress from baseline year | 100% | 73% | 79% | 77% | 81% | 50% | ||
| Increase ratio of renewable energy to over 30% by 2030 | Equity share of power generation capacity | 14% | 23% | 29% | 35% |
Above 30% |
||
*1 Forecasts as of August 2025.
*2 Emissions in the baseline year (the fiscal year ended March 2020) include the expected increase in emissions from standard operation of thermal power generation business that have made reached final investment decisions (FID).
*3 Progress from the baseline emissions (44 million t-CO2e)

GHG Impact refers to the amount of our emissions minus the emissions absorbed and offset, and the GHG Reduction Contribution we achieved through our business activities. We not only focus on reducing our own emissions, but also on contributing to the transition to a decarbonized society through our business activities. Going forward, we will accelerate our company-wide initiatives by setting specific goals, including our Reduction Contribution.
Net-zero emissions in 2050 means to reduce our emissions to effectively zero by subtracting only the emissions absorbed and offset from our emissions. The Reduction Contribution is not included in our Vision for 2050, but we will continue to actively contribute to GHG emissions reductions for society as a whole through our business.
We promote emission reduction (Reduction) and Reduction Contribution (Opportunity & Transition) in various ways, taking advantage of the cross-industrial business structure that only a global investment and trading company can offer.

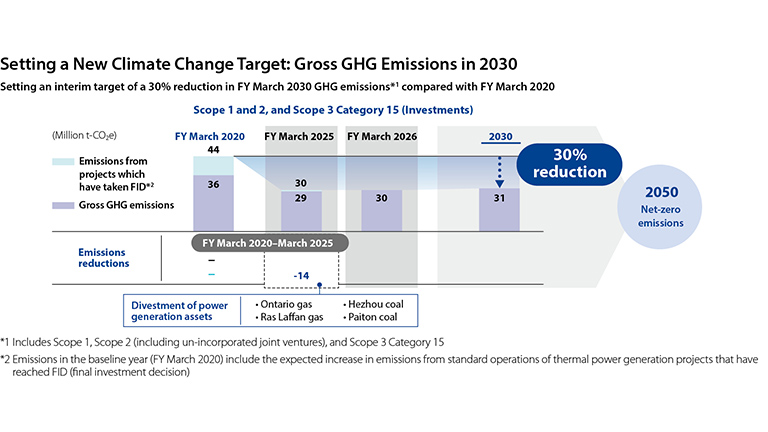
Path to Gross GHG Emissions 30% Reduction by 2030 and Achieving Net-zero Emissions
We have established a new Gross GHG emissions 30% reduction target for the year 2030. In addition to our existing GHG Impact target, we have introduced an interim target that excludes the Reduction Contribution from avoided emissions. The baseline for this new target is set at 44 million tons of total GHG emissions for the fiscal year ended March 2020, which includes emissions from power generation business that had reached Final Investment Decision (FID) by that time. The fiscal year ended March 2025, already reached a level equivalent to 30% reduction through the divestment of assets such as thermal power generation facilities. We remain committed to maintaining this level of reduction and aim to achieve a 30% reduction by 2030. Furthermore, the renewable energy ratio reached 35% in the fiscal year ended March 2025, and we will continue to promote initiatives toward achieving the 30% target set for 2030.
Reduction Contribution and Absorption
The Reduction Contribution is a quantification from a lifecycle assessment perspective of the amount of GHG emissions (Scopes 1 and 2) by third parties that were reduced and avoided by providing products and services that help to reduce GHG emissions in society through our business, compared to the amount that would have been emitted if existing products and services had been provided (baseline). The GHG Reduction Contribution is calculated with reference to the guidelines of the World Business Council for Sustainable Development (WBCSD) and the Institute of Life Cycle Assessment, Japan, etc. However, since there are no unified calculation rules at this time, we will continue to review the calculation method and disclosure as appropriate, based on international discussions and industry trends. The actual result for the fiscal year ended March 31, 2025 is 3,990 thousand tons in total (including Absorption Amount). The breakdown and calculation formula are as follows.
In calculating the Reduction Contribution, we use actual results and publicly available information to the extent possible. However, in cases where obtaining such information is difficult, we make our own assumptions and establish scenarios to the extent reasonable for our calculations.
Reduction Contribution
Please scroll horizontally to look at table below.
| Evaluation Target | FY March 2025 | Baseline | Formula |
|---|---|---|---|
| Renewable Energy | 2,684 thousand tons | Average energy mix of each country |
|
| Emissions Credits | 768 thousand tons | Before project implementation |
|
| Next-Generation Fuels | 44 thousand tons | Before project implementation |
|
Absorption Amount
Please scroll horizontally to look at table below.
| Evaluation Target | FY March 2025 | Baseline | Formula |
|---|---|---|---|
| Forests | 494 thousand tons | Before project implementation |
|
GHG emissions (Scope 3) results
Please scroll horizontally to look at table below.
(Million t-CO2e)
| Category | FY March 2023 | FY March 2024 | FY March 2025 | ||
|---|---|---|---|---|---|
| 1 | Purchased goods and services | 35.3 | 33.5 | 33.4 | |
| Breakdown by segment | Mineral & Metal Resources | 0.2 | 0.1 | 0.2 | |
| Energy | 3.1 | 3.1 | 4.1 | ||
| Machinery & Infrastructure | 2.5 | 3.2 | 3.1 | ||
| Chemicals | 12.5 | 11.9 | 9.7 | ||
| Iron & Steel Products | 7.8 | 7.7 | 7.3 | ||
| Lifestyle | 9.2 | 7.5 | 9.0 | ||
| 2 | Capital goods | 0.8 | 0.9 | 1.0 | |
| 3 | Fuel-and-energy-related activities not included in Scope 1 or 2 | 1.5 | 2.9 | 4.1 | |
| 4 | Upstream transportation and distribution | 3.2 | 1.5 | 1.9 | |
| 5 | Waste generated in operations | 0 | 0 | 0 | |
| 6 | Business travel | 0.1 | 0.1 | 0.1 | |
| 7 | Employee commuting | 0 | 0 | 0 | |
| 8 | Upstream leased assets | Not applicable | Not applicable | Not applicable | |
| 9 | Downstream transportation and distribution | Included in Category 4 | Included in Category 4 | Included in Category 4 | |
| 10 | Processing of sold products | 32.2 | 31.0 | 31.9 | |
| Breakdown by segment | Mineral & Metal Resources | 32.2 | 31.0 | 31.9 | |
| 11 | Use of sold products | 83.5 | 98.8 | 97.9 | |
| Breakdown by segment | Mineral & Metal Resources | 20.1 | 17.0 | 15.0 | |
| Energy | 37.0 | 35.2 | 39.8 | ||
| Machinery & Infrastructure | 26.0 | 46.2 | 42.4 | ||
| Chemicals | 0.4 | 0.4 | 0.7 | ||
| 12 | End-of-life treatment of sold products | 0.2 | 0.2 | 0.2 | |
| 13 | Downstream leased assets | 1.2 | 0.5 | 0.7 | |
| 14 | Franchises | Not applicable | Not applicable | Not applicable | |
| 15 | Investments | 33.6 | 30.9 | 25.9 | |
| Total | 191.5 | 200.3 | 197.1 | ||
- Figures for Mitsui and consolidated subsidiaries (including unincorporated JVs) are calculated according to the control approach (as with Scopes 1 and 2).
- Where the same emission source is clearly double-counted among the companies included in the scope of the data, only one is included in the calculation.
- If the final product into which an intermediary product is processed cannot be determined, it is excluded from the calculation.
- Approx. 70% of total emissions from Categories 1, 3, 10, 11, 12, and 13 are derived from the trading of third-party products and approx. 30% from the production/manufacturing/processing of products at Mitsui.
- Trading of third-party products is where Mitsui buys products produced/manufactured/processed by third parties to sell to processors, end users, etc. It does not include transactions with "traders" where the processor or end user cannot be determined.
- Category 1 and 11 energy-related emissions are calculated in line with the International Petroleum Industry Environmental Conservation Association (IPIECA) guidelines.
- For ferrous raw materials (iron ore and metallurgical coal), Category 10 emissions from production of crude steel are calculated proportionally by weight.
- Category 6 and 7: Calculated referencing database to calculate supply chain emissions by Ministry of the Environment.
- Category 1, 10, and 11 segment breakdowns only include the relevant segments.
Initiatives to Reduce GHG Emissions in the Value Chain
Scope 3 represents other companies' emissions and requires initiatives throughout the entire value chain. Together with our partners and customers, Mitsui is advancing initiatives in every industry in our broad range of businesses, from upstream to downstream, to cut emissions throughout society.
Examples of Initiatives to Reduce GHG Emissions
- Segments
Steel Production Value Chain
Mining & procurement
Introduction and sale of low-carbon mining machinery
Introduction of renewable energy in mining operations
Transportation
Supply of next-generation marine fuel*
Introducing next-gen equipment to improve marine fuel efficiency
— We Tech Solutions, The Switch Engineering, Power to X
Production
Low-carbon iron ore pelletizing process
— Binding Solutions
Direct reduced iron production
— JV with Kobe Steel, Ltd.
Electric furnace steel production & scrap supply
— Siam Yamato Steel, Sims, MM & Kenzai Corporation
* Methanol, ammonia, etc.
Gas Value Chain
Natural gas production & liquefacation
Assessing and pursuing introduction of CCS
— Cameron LNG/Hackberry CCS, Tangguh LNG UCC Project
Supplying low-carbon energy
— Low-carbon ammonia: Blue Point Number One, UAE Low-carbon Ammonia, Terreva, Bio methanol*3: Fairway Methanol
Assessing & introducing efficient/green energy supply at liquefaction plants, etc.
— Cameron LNG
Producing CCU methanol*4 methanol
— Fairway Methanol
Transportation & storage
Optimization of ship fuel efficiency
— Bearing.ai
Ammonia FSRU*1
Advanced pipeline repair technology to prevent GHG leakage
— STATS
Sale, usage, recovery
Provision of CCSaaS*2
— Storegga/Acorn CCS, JALMIMI/Assessing commerciality at Angel CCS
Pursing development and introduction of CO2 vessels
— CO2 storage and liquefied transportation by vessels in Malaysia
High-efficiency gas-fired power plant operations
*1 Floating storage and regasification unit
*2 A business providing customers with Carbon Capture and Storage as a Service
*3 Methanol derived from RNG
*4 Carbon capture utilization for methanol production and sales
Automotive Value Chain
Production, assembly, sales
ZEV* manufacturing & sales
— EKA, CaetanoBus, Letenda, RIVER
Parts production & sales for EVs with a focus on lightweight design
— Gestamp
Battery system production for electric mobility
— Forsee Power
Production & sale of high-pressure hydrogen tanks
— Hexagon Purus
Stable supply of battery raw materials
Material processing for EV motors
— EMS, TMS, PMS
ZEV* demand creation/solution provision
— Edmonton Airport ZEV adoption
Utilization
Hydrogen station
— FirstElement Fuel
EV charging system development & supply
— The Mobility House
Next-gen ethanol generation
— Galp/HVO
Production & sale of biodiesel fuel solution equipment
— Optimus
Large fuel-cell vehicle green hydrogen supply
— Hiringa
EV commercial vehicle fleet management
— Penske Truck Leasing
Green hydrogen production
— Lhyfe, Norwegian Hydrogen
Recycling
Metals (ferrous & nonferrous) recycling
— Sims, MM & Kenzai Corporation
Lithium-ion battery recycling
Tire recycling
— Penske Truck Leasing, MBKAL Mining Tire Recycling
Heavy commercial vehicle redistribution business
— T&M
* Zero Emission Vehicles such as EVs and FCVs that emit no CO2 or other GHG when running
Internal Carbon Pricing System
At Mitsui, we introduced the internal carbon pricing system in April 2020 to improve the medium to long-term resilience of businesses emitting large volumes of GHG, and to encourage the development of businesses that are effective at reducing our, and society's, GHG emissions. Regarding new business projects, in projects with potential risks or opportunities from GHG regulations, etc., we have added analysis of the potential impact of a 2°C and 1.5°C scenario to the project screening factors, as well as the adequacy of countermeasures in the event these risks are realized. We are also using the internal carbon pricing system to assess risks in existing businesses. The pricing is based on definitions and prices published by the IEA and other external organizations, taking into account the location and time horizon of the assets. Over the period through 2050. Under the 2°C scenario, we apply prices of approximately 140-220 USD/ton for developed countries and approximately 50-160 USD/ton for other regions. Under the 1.5°C scenario, we apply prices of approximately 220-250 USD/ton for developed countries and generally 50-220 USD/ton for other regions.
Other Environmental Indicators/Targets
By promoting businesses that help to bring about a decarbonized society, including cleantech technology, we aim to increase invested capital by approximately 1 trillion yen as stated in the Medium-term Management Plan 2026, with ROIC exceeding 5% in the fiscal year ending March 31, 2026, and 9% in the fiscal year ending March 31, 2030 (as of May 2023).
Collaborating with Stakeholders
Participation in Initiatives
As a responsible global company, we are advancing and expanding our response to climate change by participating in initiatives based on international frameworks and wide-ranging partnerships through industry organizations in Japan. In our international initiatives, we signed the United Nations Global Compact in 2004 and declared our support. We also invest in the Human Rights Due Diligence Subcommittee of the Global Compact Network Japan, among other activities. Furthermore, to comply with the Paris Agreement and achieve medium- to long-term targets for reducing greenhouse gas emissions of national governments including Japan, we comply with environmental laws and regulations such as the Energy Conservation Law. We are also actively involved in the formulation and design of government-led policies and programs such as the GX League, etc. Our decision to invest in each initiative is made once we have confirmed that it is compatible with our basic policy and initiatives concerning climate change, and we will disclose information appropriately to our stakeholders.
TCFD (Task Force on Climate-related Financial Disclosures)
TCFD Consortium
CDP (Climate Change)
Maersk Mc-Kinney Moller Center for Zero Carbon Shipping
International Iron Metallics Association
ASI (Aluminium Stewardship Initiative)
The Copper Mark
Battery Association for Supply Chain
Keidanren (Japan Business Federation)
Japan Foreign Trade Council
GX League
Japan Hydrogen Association
Forest Stewardship Council® (FSC®)
PEFC/SGEC
Carbon Recycling Fund Institute
The Institute of Applied Energy, Society of Anthropogenic Carbon Cycle Technology
Clean Fuel Ammonia Association
The Oil and Gas Decarbonization Charter (OGDC)
Initiatives
Our Medium-term Management Plan and Environmental Policy both call for action on climate change, and we are promoting initiatives to reduce our environmental impact through dialogue with suppliers and other business partners along the value chains in which we are involved; the aim is to achieve both economic development and a response to climate change. In addition to renewable energy and modal shift businesses, we are also working to expand and promote various businesses and technologies that contribute to the reduction of CO2 emissions and improvement in energy consumption efficiency.
Making Energy Use Carbon-Neutral across All Business Locations in Japan (Using J-Credits)
We offset the CO2 emitted from the use of energy, at our Head Office, all branches and offices in Japan, and training centers, by applying emissions credits (J-Credits) generated by Konan Utility and a company in which we have invested.
Renewable Energy
- Digital & Infrastructure Solutions Business Unit
In our power generation business we intend to lower the share of coal-fired power in our equity share of power generation capacity, and increase the renewable energy ratio (including hydropower) to 30% by 2030. As of March 31, 2026, renewable energy, including hydropower, accounted for approximately 34% of Mitsui's equity share of power generation capacity of 9.43 GW.
Power Generation Businesses
Please scroll horizontally to look at table below.
(As of March 31, 2026)
| Energy resources | Net generation capacity (Mitsui's share) (MW)* | Ratio | Target | ||
|---|---|---|---|---|---|
| Natural gas |
5,189 |
55% |
Less than 70% |
||
| Coal |
762 |
8% |
|||
| Oil |
252 |
3% |
|||
| Renewable Energy |
3,222 |
34% |
More than 30% |
||
| breakdown | Solar |
1,165 |
|
|
|
| Hydropower |
816 |
||||
| Wind |
1,222 |
||||
| Solar thermal |
15 |
||||
| Biomass |
2 |
||||
| Geothermal |
2 |
||||
| Total |
9,425 |
100% |
100% |
||
* Including assets under construction
Please refer to the link below for more information.
Investment in India's Large-Scale Renewable Energy Business
- Digital & Infrastructure Solutions Business Unit
Through our wholly owned subsidiary MIT Power India, we are an investor in the development of a large-scale renewable energy business promoted by ReNew Private Limited, the largest renewable energy company in India. The business will consist of three newly built wind farms in India (900 MW in total) and one solar power plant (400 MW plus a battery storage farm with a capacity of up to 100 MW). The business will provide 400 MW of electricity to Solar Energy Corporation of India Limited (SECI), an entity owned by the Indian Ministry of New & Renewable Energy, based on a 25-year power purchase agreement. Whereas it is difficult for conventional renewable energy projects to commit stable electricity supply due to the intermittent nature of winds and solar irradiation, this business commits electricity supply on a round-the-clock basis from a portfolio consisting of multiple wind and solar facilities plus battery storage farms. This "round-the-clock scheme" is the first of its kind in India. The total cost of the business will be around USD 1.35 billion. Commercial operations have started in phases site by site. Mitsui will contribute to the business by using its accumulated knowledge of the electric power business in Japan and other countries to ensure steady progress toward completion and the smooth rollout of commercial operations.
India, the third-largest emitter of GHGs, declared its commitment to cut its emissions to net-zero by 2070 at the 26th Conference of Parties (COP26) held in November 2021 and announced that it will raise its non-fossil energy capacity to 500 GW by 2030. This round-the-clock scheme project, enabling electricity supply with 100% renewables, is in line with the Indian Government's policy and is expected to play an important role in the future to replace the coal-fired power plants currently predominant in India. Renewable energy is a business field that is likely to keep expanding in India, where continuous population and GDP growth are expected. Through this business, we will contribute to solving the power shortage in India and encourage decarbonization.
Next-generation Fuels
Low-carbon Ammonia
We are working to build a value chain for low-carbon ammonia by leveraging our strengths as a diversified global investment and trading company with touchpoints across a wide range of industries.
Low-carbon Ammonia Production Business (UAE)
- Integrated Energy Solutions Business Unit
- Basic Materials Business Unit
We have begun construction of an ammonia production facility in the United Arab Emirates, in partnership with TA'ZIZ (backed by Abu Dhabi National Oil Company (ADNOC). The partnership also includes Fertiglobe (a manufacturer and exporter of urea and ammonia), and GS Energy (a Korean energy-related business). The plant is being developed within the TA'ZIZ Development Area in the Ruwais Industrial Complex, UAE. Beginning in 2027, the facility is expected to produce 1 million tons of ammonia annually with lower CO2 emissions compared to conventional methods. In addition, additional facilities will be installed to capture and store CO2 generated during production, aiming to manufacture low-carbon ammonia by 2030.
Ammonia is attracting attention as a zero-emission fuel that does not emit CO2 when burned, and also as a carrier for hydrogen. A certain portion of the ammonia produced will be procured and supplied mainly to Japan and other parts of Asia. In addition to fuel applications, it will be used as a feedstock for chemicals and fertilizers, contributing to decarbonization across society, including other industrial sectors.
In the energy sector, we have been developing and managing liquified natural gas business with ADNOC in UAE since the 1970s. We also have approximately 50 years of experience in the ammonia business and are the largest Japanese importer of ammonia. By integrating the cross-sectoral expertise and partnerships we have cultivated through existing businesses, we will advance the development of a low-carbon ammonia supply chain that responds to the decarbonization needs of countries and regions.
Low-carbon Ammonia Production Project (US)
- Basic Materials Business Unit
- Integrated Energy Solutions Business Unit
Mitsui has made a final investment decision to participate in the Blue Point low-carbon ammonia production project in the United States (the "Project"), together with CF Industries Holdings, Inc. (CF Industries) and JERA Co., Inc. (JERA).
The plant will be constructed in the state of Louisiana in partnership with CF Industries, the world's largest ammonia producer, and JERA, Japan's largest power generation operator. It will be one of the world's largest low-carbon ammonia production facilities, with an annual production capacity of approximately 1.4 million tons. Construction will begin in 2025, with operations scheduled to start in 2029.
The low-carbon ammonia produced will be procured by each shareholder, and we plan to supply our share mainly to Europe and Asia. The business is expected to capture and store 2.3 million tons of CO2 annually, reducing CO2 emissions from the production process by more than 95%.
As a priority area within "Global Energy Transition," one of the Key Strategic Initiatives under Medium-term Management Plan 2026, we aim to contribute to a wide range of low-carbon industries through the production and sale of low-carbon ammonia, which is attracting attention as a next-generation fuel in addition to its conventional use as a feedstock for fertilizers and chemicals.
Biofuels
Renewable Diesel and SAF Production in Portugal
- Integrated Energy Solutions Business Unit

We are jointly promoting the production of renewable diesel (hydrotreated vegetable oil, HVO) and sustainable aviation fuel (SAF) with Galp SGPS, S.A. (Galp), Portugal's largest energy company, at the Sines Refinery in Portugal owned by Galp.
In Europe, policies to introduce biofuels in the transportation sector are being heavily promoted as part of the trend toward energy transition for the purpose of decarbonization. In this business, HVO, which is produced from used cooking oil and animal and vegetable fats, can be introduced as an alternative biofuel to diesel for internal combustion engine vehicles such as buses and trucks, and SAF as an alternative jet fuel for aircraft.
As part of efforts to build a portfolio of next-generation fuel businesses, we will invest in the biofuels production business, and will simultaneously take on the responsibility of procuring raw materials mainly from Asia and developing product sales outlets in Europe, where there is a supply-demand gap. The aim is to fulfilling functions throughout the value chain. Through our participation in this business, we will help to solve the urgent and complex global issue of addressing climate change through cross-industry initiatives.
Hydrogen-related
- Integrated Energy Solutions Business Unit
When hydrogen is consumed, it generates no greenhouse gases or environmentally harmful substances. Hydrogen is a focus of attention around the world as a clean fuel that does not generate an environmental burden. With our Energy Solutions Business Unit at the core, we engage in cross-company collaboration utilizing the networks and knowledge of each business segment, working on our hydrogen business in a way that demonstrates our comprehensive strength. We regard the hydrogen business as an effective approach to achieve our net-zero emissions goal, and will work together with our stakeholders to build necessary social infrastructure and create profitable businesses.

Green Hydrogen Production Business in Western Australia
- Integrated Energy Solutions Business Unit
Green hydrogen, which is produced from renewable energy, will play a pivotal role in industrial decarbonization and holds significant potential as a clean energy source. This is because renewable hydrogen emits no CO2 in the production and burning process and can be used in various industries. We are participating in a green hydrogen production business in the Pilbara region of Western Australia. In this business, a joint venture between major French energy player Engie S.A. and Mitsui will deploy a 10-MW electrolyzer powered by 18 MW of solar PV to generate and supply renewable hydrogen for an existing ammonia production facility owned by Yara Pilbara Fertiliser Pty Ltd (YPF). YPF is a wholly owned subsidiary of Yara International ASA, one of the world's largest producers of nitrogen-based mineral fertilizers, and will use the renewable hydrogen as a zero-carbon feedstock for ammonia production.
Green Hydrogen Production Business in Europe
- Performance Materials Business Unit

In April 2022, we invested in two green hydrogen producers in Europe: Lhyfe SA and Norwegian Hydrogen AS (NH). Lhyfe was established in 2017 and has demonstrated its capabilities and started its first commercial wind power-derived hydrogen production plant in 2021. Currently, Lhyfe has a 9.9-GW green hydrogen project pipeline for both industry and mobility, and is targeting the launch of green hydrogen production with a total capacity of 3 GW by 2030. NH was established in 2020 and has a handful of projects in the pipeline in Scandinavia. NH's first two renewable hydrogen production plants in Denmark and Norway will begin commercial operation in 2024. Through our equity participation in Lhyfe and NH working on local production for local consumption, we will strengthen our partnership with these companies and expand our existing hydrogen-related business. By establishing a strong presence in the European hydrogen market, we will contribute to and accelerate the reduction of GHG emissions with development of green hydrogen in Europe for the future.
Decarbonization Solutions for the Mobility Sector
- Performance Materials Business Unit
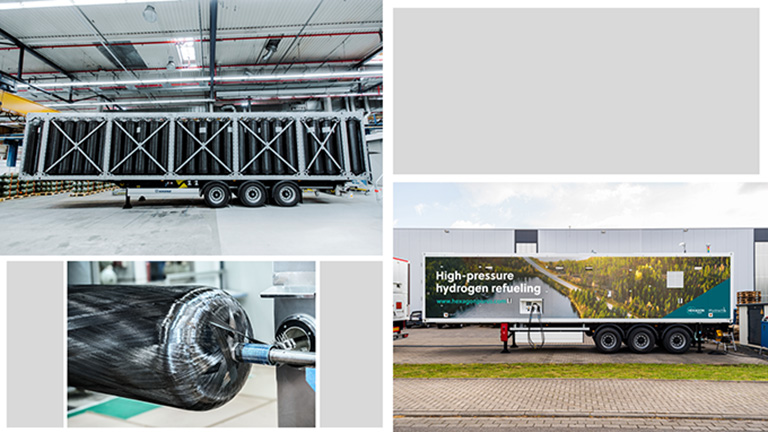
We have agreed to subscribe for additional convertible bonds issued by Norwegian company Hexagon Purus ASA (Purus) in October 2024. Purus supplies high-pressure hydrogen cylinders and systems used for fuel tanks in fuel-cell electric vehicles (FCEVs), for overland transportation of hydrogen and for other purposes, and also provides vehicle integration services. This will be our second subscription for convertible bonds issued by Purus, following the first one in March 2023.
We have been a shareholder in Hexagon Composites ASA, the world's biggest manufacturer of carbon fiber-reinforced high-pressure gas containers, since 2016, and have collaborated with them on various business initiatives. By also investing in Purus, a subsidiary of Hexagon Composites, which has expertise relating to hydrogen pressure-cylinder manufacturing, the design of cylinder-based hydrogen supply systems, and commercial vehicle integration, we have been expanding the scope of this collaboration in anticipation of the introduction of commercial FCEVs, including trucks and buses, in Europe, the United States, and other world markets. The investment will enable us to tap into rising demand for the transportation of locally produced hydrogen for local consumption. In particular, there has been growing demand for distribution modules and trailers used in hydrogen transportation and for mobile hydrogen refuelers, which is a key business area for Purus; sales in this area are expanding, mainly in Europe. Furthermore, Purus has concluded several large contracts to supply hydrogen cylinders for fuel-cell trucks and to provide vehicle integration business, and is also developing mass-production systems to meet this demand.
Through additional underwriting of convertible bonds, we will help to meet the company's increasing need for growth funds, including funds for investment in capacity expansion in readiness for growth in hydrogen demand resulting from the future introduction of regulations and incentives. Moreover, through this strategic alliance, we will create new business opportunities in the electrification of mobility by leveraging Mitsui's business and customer base, support enhancement of Purus's corporate value, and contribute to the achievement of zero emissions not only for commercial vehicles, but also for other mobility industries such as maritime shipping, rail transportation, and aviation.
e-Methanol
e-Methanol Production and Sales Business in Denmark
- Basic Materials Business Unit
- Infrastructure Projects Business Unit
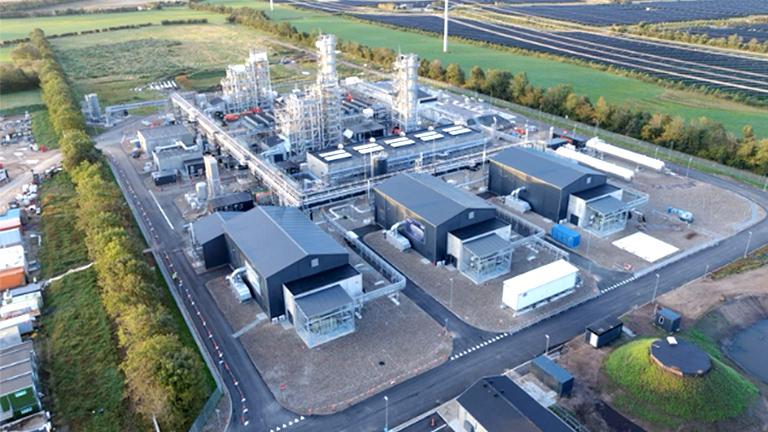
We have started producing e-methanol at the plant operated by Solar Park Kasso ApS, a joint venture in Denmark between Mitsui and European Energy A/S. e-Methanol is a synthetic methanol produced using renewable hydrogen and CO2 as feedstocks. It is gaining attention as a next-generation synthetic fuel capable of significantly reducing environmental impact. In May 2025, the e-methanol produced at this facility was supplied as a next-generation marine fuel to the Laura Maersk, operated by A.P. Moller – Maersk. This marked the world's first bunkering of e-methanol produced at a commercial-scale facility.
Through this operating company, we are contributing not only to the low-carbon marine fuels but also to the low-carbon raw materials for plastics by supplying e-methanol to the LEGO Group and Novo Nordisk.
Electricity Resource Development and Energy Management
Distributed Solar Power Generation Business
- Digital & Infrastructure Solutions Business Unit
We have established a 100% subsidiary, Forefront Power, in California, the center of clean energy, and acquired the Commercial & Industrial Division (C&I) of SunEdison in 2017, which develops and operates a distributed solar power generation business. The purpose is to pursue new opportunities at the forefront of the renewable energy business. Forefront Power is working on an "Onsite Solar" business, which sells electricity from solar power facilities installed by customers to the customers themselves, and "Community Solar" business, which sells electricity to multiple customers from solar power facilities installed outside of customer sites. The company is also working on energy management services such as solar advising, third-party solar asset management services, and solar + storage services.
Natural Gas-fired Power
- Global LNG Business Unit
- Digital & Infrastructure Solutions Business Unit
Fukushima Gas Power Co., Ltd., our equity accounted investee, has two natural gas-fired power facilities at its Fukushima Natural Gas Power Plant in Soma, Fukushima Prefecture. These have a total power output of 1.18 million kW. The power generation facilities use a gas turbine combined-cycle system with high power generation efficiency. This combination of a gas turbine and a steam turbine generates a lower level of CO2 than coal-fired or gas turbine-only power generation methods.
This business is in line with Fukushima Prefecture's goals of the "introduction of energy with a low environmental impact" and "new urban development" under the Fukushima Innovation Coast Framework. Through promoting this business, Mitsui & Co. will contribute to the economic revitalization in the Hama-dori region of Fukushima prefecture to help in its ongoing recovery from the 2011 earthquake. We will continue to work on the sustainable and stable supply of resources that are essential for social development and the creation of a society that is in harmony with the environment.
EV (Electric Vehicles)
- Mobility Business Unit I
- Digital & Infrastructure Solutions Business Unit
Among the mobility (transportation) areas that we have defined as our new growth areas, we expect electrification (the shift to electric vehicles) to be particularly promising. In Europe, where the introduction of EVs is gathering momentum, we are building a comprehensive business model that supports the changeover to EVs, including infrastructure, and are expanding it in other regions as well.
We are organically linking several companies in which we have an interest in order to build a new business model that can provide comprehensive solutions. These include EV makers (CaetanoBus-Fabricação De Carroçarias S.A, Letenda Inc.), battery pack manufacturers (Forsee Power SA), and an energy management company that uses EV batteries (The Mobility House AG). For example, if a city considers switching its fixed-route buses to EV, we would like to help the city speed up its changeover to electric vehicles. In concrete terms, we can offer a comprehensive range of services including EV bus supply, battery leasing, and energy management. Furthermore, in future, we are also considering businesses involved in the reuse and re-leasing of used batteries. We will begin these initiatives in Europe and the United States, and then expand them to Asia.
ZEV (Zero-Emission Vehicle) Business in Europe and India
- Mobility Business Unit I
Caetanobus - Fabricacao de Carrocarias, S.A. (CaetanoBus) of Portugal, in which we have invested, has been developing electric buses since 2010. It has introduced EV ramp buses for airport passenger transportation, EV city buses and FC (fuel cell) city buses, mainly in Europe, to the market in stages, providing optimal solutions tailored to operations for a decarbonized society. We will continue looking to provide the optimal solutions suitable for operations seeking to achieve a carbon-free society. In India, we have invested in Pinnacle Mobility Solutions Private Limited (Pinnacle Mobility), which is developing an electric bus and electric light commercial vehicle manufacturing and sales business under the EKA brand, and World of River Limited, which is developing an electric motorcycle manufacturing and sales business under the River brand since 2023. Pinnacle Mobility will take on the challenge of creating demand for EVs in India, which is expected to grow in the future, and help to ease India's serious air pollution problem. With CaetanoBus and Pinnacle Mobility at the core of our ZEV business, we will further promote the electrification and decarbonization of mobility and contribute to the creation of a society in harmony with the environment.
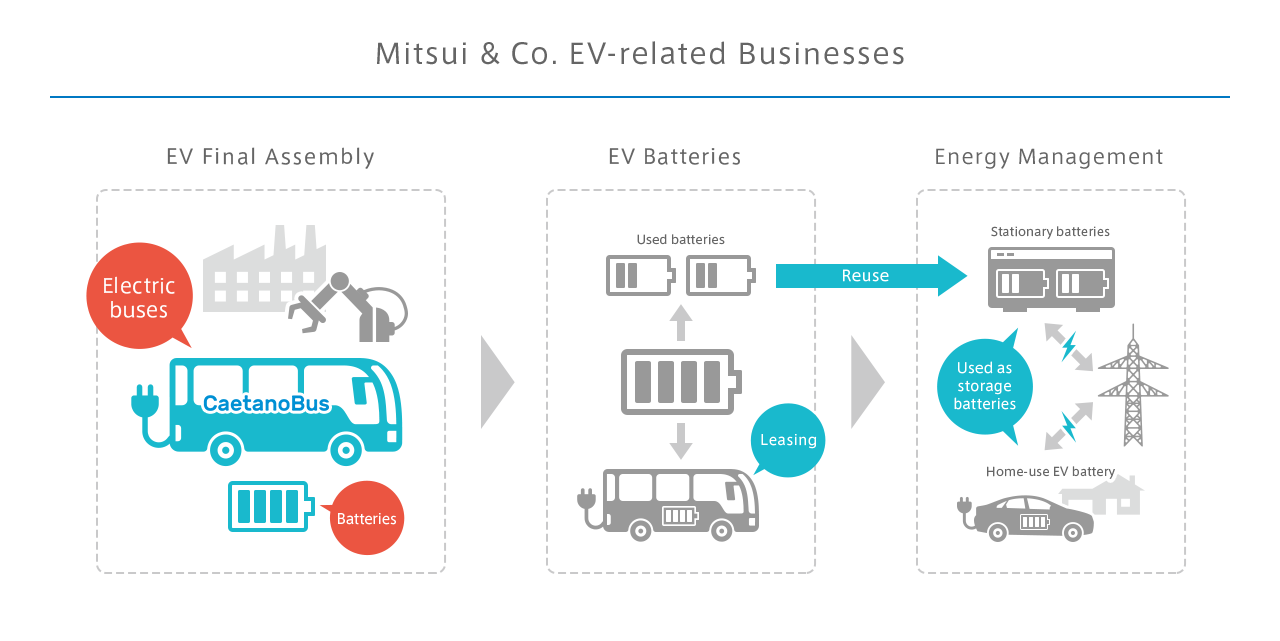
360° business innovation: FULL CHARGE AHEAD: Assembling an EV value chain for the smart-city era
Biodiesel Fuel Solution Equipment Manufacturing and Sales Business
- Mobility Business Unit I

We have invested in Optimus Technologies, Inc. (Optimus Technologies) a US company that has developed its Vector System technology. This is an innovative and practical way to reduce carbon emissions in heavy-duty diesel operations. This system enables internal combustion engine vehicles to run on 100% biodiesel fuel (BDF). Although it will likely enter use as a renewable fuel alternative to diesel oil for decarbonization, given that the use of BDF in high concentrations increases the risk of vehicle malfunctions, BDF has conventionally been mixed with diesel fuel to the extent of 5-20%, limiting its decarbonization effect. The use of BDF in 100% concentration with Optimus Technologies' product helps to significantly reduce CO2 emissions, can be used in cold regions, and can switch to running on diesel fuel without vehicle modification. In addition, the relatively small impact on vehicle payload and the immediate reduction in emissions give it an advantage over battery-electric and hydrogen fuel-cell trucks. Optimus Technologies also provides comprehensive solutions to help customers achieve smooth decarbonization, including telematics, fleet management support, CO2 reduction reports, and leasing of BDF supply stations. In cooperation with Optimus Technologies, we will promote the introduction of its products and technologies in the US market as well as in other Asian markets.
Industrial Operations & Automation
- Corporate Development Business Unit
+Automation Inc. (+A), our affiliated company, is a logistics robotics services company that resolve issues that warehouse operators face, such as the growing complexity of operations due to diversified consumer needs and labor shortages. They do this by leveraging Mitsui's global network-based robot procurement capabilities and the knowledge of its logistics subsidiaries—JA Mitsui Leasing Group's finance, GLP Japan Inc.'s customer network as a leading logistics real estate company, and Toyota Industries Corporation's engineering expertise as a global logistics solutions provider. With the number of robots installed having exceeded 6,000 as of May 2025, +A is accelerating its service deployment. It is working to add further value by providing "+Hub," a proprietary warehouse execution system that enables linkage of a variety of robots, material handling equipment and logistics systems. Nowadays, since it is normal for consumers to have anything they could ever want delivered directly to them, building sustainable logistics services is essential. Through "Robotics as a Service (RaaS)," a standardized subscription-type service that provides operational design, system development, and utilization support that is tailored to customers' needs, +A is engaged in bringing satisfaction and joy to people working on the front lines of logistics while strengthening the logistics industry.
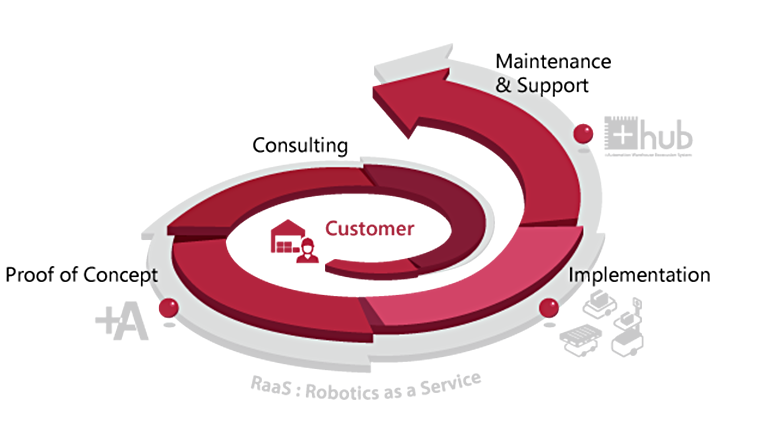
Air Quality
Investment in the CCS Business
- Global LNG Business Unit
- Integrated Energy Solutions Business Unit
We are focusing on launching and promoting the CCS as a Service (CCSaaS) business as a core business of the current and next-generation E&P business, in addition to reducing CO2 emissions from our own assets. We position the CCS/CCSaaS business, which leverages our expertise in the upstream oil and gas business and extensive business network, as one of our energy solution areas. Based on our experience in developing businesses related to CO2 separation, recovery, and storage, which are ahead of those in Europe, we are promoting the launch of the CCS business globally. We are conducting investigations and considering business viability across the entire value chain of CCS in the Asia-Pacific region, including Japan, in collaboration with Kansai Electric Power Co., Inc., Chugoku Electric Power Co., Inc., Mitsubishi UBE Cement Corporation, and Resonac Holdings Corporation. In Malaysia, we have signed a contract with Petronas, an oil company in Malaysia, and TotalEnergies in France for the joint development of CO2 storage sites. This partnership will focus on the gas fields and surrounding regions off the Malay Peninsula, including a development plan based on the technical evaluation of CO2 underground storage, and optimization of logistics that includes transportation by liquefied CO2 ships and design of port facilities.
Indonesia's Tangguh Ubadari, CCUS, Compression (UCC) Project reached Final Investment Decision in late 2024. It is an initiative contributing to the transition to a decarbonized society in a sustainable manner. It also contributes to helping to maintain a stable energy supply to Asian countries, including Japan, and is Indonesia's first at-scale LNG project.
We are working on a joint study with Sempra Infrastructure in US, Total Energies in France, and Mitsubishi Corporation, who are partners in the Cameron Liquefied Natural Gas (LNG) Project, aiming to commercialize CCS in Louisiana, USA, through Hackberry Carbon Sequestration, LLC (100% subsidiary of Sempra Infrastructure). This project mainly involves storing CO2 emitted from the Cameron LNG Project in underground areas near the project, which will help to reduce greenhouse gas emissions during LNG production. In addition, this study will also consider the possibility of receiving CO2 emissions from surrounding industries and storing them underground. Prior to the start of the study, in August 2021, we applied to the US Environmental Protection Agency for permits for well drilling and CO2 storage of up to 2 million tons per year at the CCS project site.
We will continue to contribute to reducing CO2 emissions from each company through CCS and the supply of low-carbon LNG.
CCU — Producing Methanol in the US that Uses CO2 Effectively
- Basic Materials Business Unit
Our equity accounted investee, Fairway Methanol LLC has begun producing methanol by using carbon dioxide (CO2) emitted from plants surrounding the joint venture's facility. Fairway Methanol is expected to capture 180 thousand tons of CO2 and produce 130 thousand tons of low-carbon methanol per year, which brings its annual production capacity to 1.63 million tons per year. This additional methanol production, using industry-derived CO2, is one of the carbon capture and utilization (CCU) projects that Mitsui has undertaken. The concept behind these projects considers CO2 as a resource that can be reused as a raw material and fuel, thus realizing carbon recycling and helping to reduce CO2 emissions into the atmosphere. This project provides Mitsui with another low-carbon solution in its methanol business portfolio, following the bio-methanol (mass-balance basis) production at Fairway Methanol and the e-methanol production at Solar Park Kasso, Denmark.
Materials
Certifications
- Performance Materials Business Unit
- Integrated Energy Solutions Business Unit
Green Buildings
We aim to invest in environmentally friendly buildings and make energy use in our existing buildings more efficient through environmental and energy-saving measures in order to build a portfolio of properties that have a low environmental impact.
Otemachi One (Mitsui & CO. Building and Otemachi One Tower)
DBJ Green Building Certification is a certification system that evaluates environmentally and socially conscious real estate. Otemachi One (Mitsui & CO. Building and Otemachi One Tower), an office building owned by our company and others, has been certified as "one of Japan's top-class, superior buildings exhibiting excellent environmental and social awareness" under DBJ Green Building Certification system.
Japan Logistics Fund, Inc.
- Corporate Development Business Unit
Japan Logistics Fund, Inc. (JLF), a listed REIT is operated by our subsidiary Mitsui & Co., Logistics Partners Ltd., owns and manages 53 logistics facilities (as of March 2025).
With regard to JLF, we actively promote ESG initiatives in the management of logistics facilities. We believe that obtaining objective evaluations and certifications will enable us to understand the positioning and the challenges of JLF's ESG initiatives, and enable us to further strengthen our efforts. We are therefore working to obtain Green Building Certification and improve the results in third-party evaluations.
Acquiring External Certification
GRESB Real Estate Assessment
GRESB is an annual benchmarking assessment, which measures the ESG integration of real estate companies and funds. In the 2023 assessment, Japan Logistics Fund, Inc. received the highest rating of five stars. In addition, the company received a "Green Star" for the seventh consecutive year in both the "Management Component," which evaluates the company's policies and organizational structure for ESG promotion, and the "Performance Component," which evaluates the company's environmental performance and tenant engagement at owned properties.
SBT for SME Certification
JLF has established Scope 1 and 2 greenhouse gas emission reduction targets of 42% below the FY March 2021 level by FY March 2030 and net-zero by FY March 2050. Of these, the greenhouse gas emission reduction targets by FY March 2030 were recognized by the SBT Initiative, an international organization, as following the goals of the Paris Agreement that "aims to keep the global average temperature well below 2°C above pre-industrial levels and pursue efforts to limit global warming to 1.5°C." JLF has received the Science-Based Targets (SBT) for SME certification from the international SBT initiative in 2022.
Green Finance Framework Assessment
We have established the Green Finance Framework, with the aim of further promoting sustainability-related initiatives through green finance and strengthening our fund-raising base by expanding the investor base interested in ESG investment. JLF has obtained a Green 1(F) (highest for JCR Green Finance Evaluation) rating for the competence of its Green Finance Framework from Japan Credit Rating Agency, Ltd. (JCR)
Acquisition of Green Building Certifications
JLF aims to build a portfolio with low environmental impact by investing in properties that have a small environmental footprint, and improve energy efficiency through environmental and energy conservation measures in the management of its properties. In addition, when redeveloping owned properties (OBR), the company intends to obtain Green Building Certification after the redevelopment.
Percentage of Portfolio with Green Building Certification (as of March 31, 2025)
Please scroll horizontally to look at table below.
| Type of certification | Number of properties | Leasable area (m2) | Percentage of portfolio (by area) |
|---|---|---|---|
| CASBEE Certification for Real Estate*1 | 50 | 1,487,349.31 | 98.2% |
| BELS Certification*2 | 25 | 716,850.89 | 47.3% |
| CASBEE Certification for Buildings (New Construction)*3 | 1 | 41,968.06 | 2.8% |
| Percentage of portfolio with Green Building Certification | 51 | 1,498,004.77 | 98.9% |
As some properties have multiple certifications, the total of the figures for each certification type does not equal the figure for the "Percentage of portfolio with Green Building Certification."
*1 CASBEE is a method designed to comprehensively assess the environmental efficiency of buildings, and is promoted throughout Japan under the guidance of the Ministry of Land, Infrastructure Transport and Tourism. Certification for CASBEE for Real Estate is a system where third-party institutions examine and certify assessment results prepared in accordance with CASBEE for Real Estate. The certification rating is represented by the number of stars on a four-tier scale from five stars "★★★★★" ("S") to two stars "★★" ("B").
*2 BELS is a third-party certification system in Japan that indicates the energy efficiency of buildings. Since April 2016, the Act on the Improvement of Energy Consumption Performance of Buildings (Building Energy Efficiency Act) requires real estate companies to make efforts to indicate the energy efficiency of buildings. The specific indication method is stipulated in the guidelines for energy efficiency labels of buildings. BELS is evaluated based on the same guidelines, and the assessment result is represented by the number of stars (one star "★" to five stars "★★★★★"); from April 2024, it is shown on a scale of seven levels (Level 0 to 6). A Net-Zero Energy Building (ZEB) is a building that aims for zero energy balance with considerably reduced annual energy consumption by saving as much energy as possible. Ways to save energy include better heat insulation, solar shading, natural energy and high-efficiency equipment, coupled with creating energy by solar power generation (or other energy-generating methods), while maintaining a comfortable environment. In addition, in the BELS certification system, it is possible to obtain certification under four levels (ZEB, Nearly ZEB, ZEB Ready, and ZEB Oriented).
*3 CASBEE Certification for Buildings (New Construction) is a system for evaluating the overall environmental performance of a building. It evaluates and rates the environmental performance of buildings based on energy and resource conservation, recycling and other environmental burden reductions, as well as interior comfort and landscaping.
Mirai Corporation
- Corporate Development Business Unit
Mitsui Bussan & Idera Partners, our associated company that manages the assets of listed Real Estate Investment Trust MIRAI Corporation, is promoting sustainability-related measures that include ongoing participation in real estate assessments, as well as green financing, in accordance with our Sustainability Policy.
Acquiring External Certification
GRESB Real Estate Assessment
Listed Real Estate Investment Trust MIRAI Corporation earned four Stars in the GRESB Real Estate Assessment in 2024, based on the relative evaluation of its overall score. MIRAI also earned a "Green Star" in both the "Management Component," which evaluates the company's policies and organizational structure for ESG promotion, and the "Performance Component," which evaluates the company's environmental performance and tenant engagement at owned properties. It was also awarded a "Level A" in GRESB Public Disclosure, which assesses the adequacy of sustainability information disclosure.
Percentage of Environmental Certifications Acquired
The percentage of environmental certifications in the portfolio is as follows.
(As of March 4, 2025)
| Based on gross floor area |
|---|
| 69.0% |
Mirai Corporation has acquired DJB Green Building Certification for nine properties, CASBEE Certification for Real Estate for five properties, and Building-Housing Energy-efficiency Labeling System (BELS) Certification for one property.
Forest Sinks and Emission Credits Business
- Integrated Energy Solutions Business Unit
Generation and Sale of Carbon Credits through Regeneration of Native Vegetation
We have invested in Climate Friendly Pty Ltd, which generates and sells carbon credits through vegetation restoration on farms in Australia. Climate Friendly is engaged in GHG reduction business through restoring vegetation in Australia.
The regenerated farms absorb CO2 from the atmosphere and Climate Friendly sells the resulting GHG reductions as carbon credits. They had achieved 30 million tons of GHG reductions by 2023, making them the largest emissions credit developer in the country. The vegetation restoration business also has secondary effects such as protecting ecosystems and biodiversity, and improving soil, in addition to CO2 absorption and fixation in the atmosphere. This contributes to the Australian government's GHG reduction targets. The demand for credit for private companies to reduce emissions is also expected to keep growing.
Generation and Sale of Forestry-derived J-Credits through Proper Forest Management

Mitsui has been working on the generation and sale of J-Credits (forest J-Credits) by conducting appropriate forest management in Japan as part of our efforts to address the issue of climate change by applying industrial solutions. Since 2019, we have lobbied for regulatory reforms to enable large-scale J-Credit creation using aerial survey data and satellite data, and have commenced commercialization activities by using our 45,000 hectares of company-owned forests across Japan. Currently, we are promoting joint creation projects with several forestry corporations (such as the Okayama Forest Maintenance Public Corporation) and local governments. As of August 2024, we have completed project registration of forest J-Credits for about 5 million tons of CO2, which accounts for approximately 60% of the total expected forest J-Credit certification by the fiscal year 2050. Furthermore, we have started making sales since obtaining credit certification and issuance in 2023. We provide these J-Credits as a way for GHG-emitting companies to meet their offset needs for emissions that cannot be reduced through their own GHG reduction efforts, such as energy-saving devices and the adoption of renewable energy sources, to achieve their carbon-neutrality targets. Moreover, by utilizing the revenue from these J-Credits to manage forests appropriately, we aim to enhance the multifaceted value of regional forestry resources, solve forest management challenges through revitalizing the forestry management business, and help to rebuild local economies. We will continue to actively engage in the creation and sale of credits moving forward.
Financing
Use of Sustainability Linked-Loans
Mitsui uses sustainability linked-loans (SLLs) as part of our efforts to realize a sustainable society. These loans incorporate KPIs related to climate change response, and the financing terms and conditions are subject to change depending on the extent to which these targets are achieved. Through such financing methods, we aim to integrate response to environmental issues into our corporate management and achieve both sustainability and increased corporate value.