Sustainable Enhancement
of Corporate Value
Opening Remarks
Shigeta, CFO (Shigeta) : I am Tetsuya Shigeta, CFO. Today, I would like to speak about the sustainable enhancement of corporate value.
Specifically, I will explain the enhancement of Core Operating Cash Flow (COCF) and profit through the improvement of our business portfolio and thorough execution of our middle game initiatives, as well as our track record and future challenges regarding ROIC, which we introduced as a KPI from the previous Medium-term Management Plan (MTMP) and have been working to instill. I will also explain our track record of enhancing cash inflows, profit and shareholder returns, all on a per share basis, through continuous share repurchases and cancellation of treasury stocks.
Track Record of Cash Generation Capability and Cash Inflows per Share
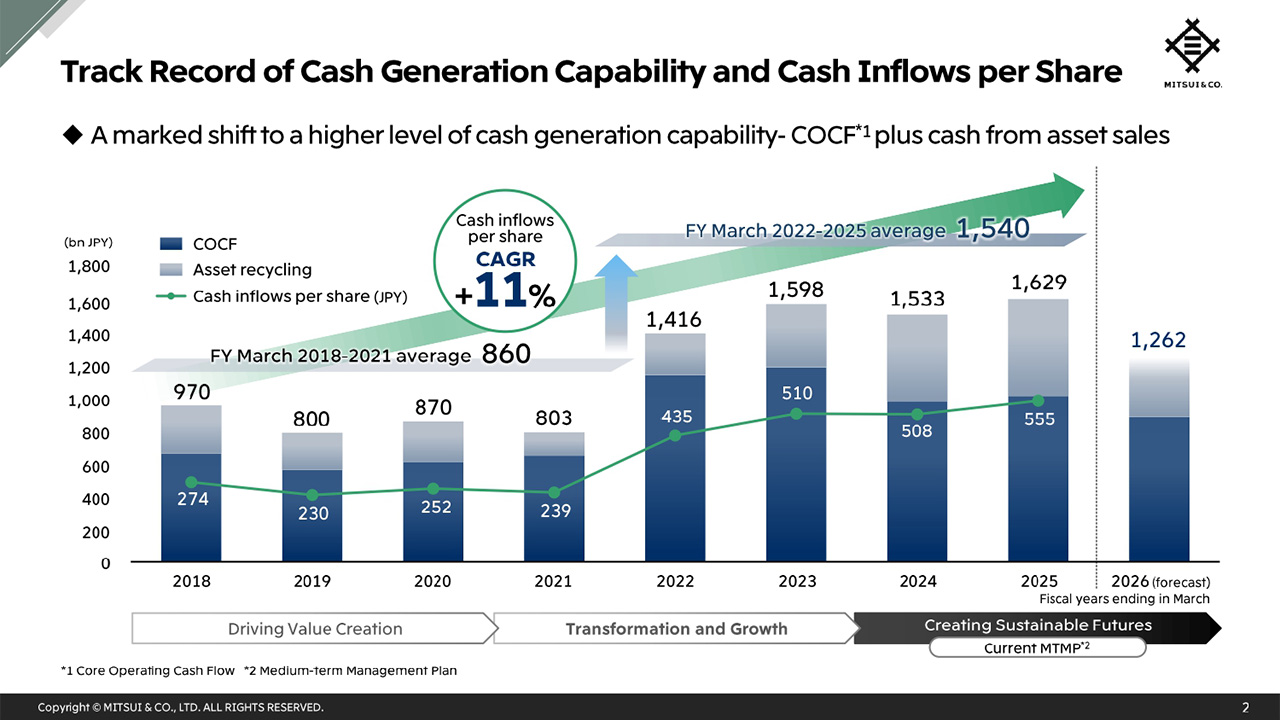
We have remained committed to cash flow management and strengthened our cash generation capability. We have steadily enhanced our total cash inflows, consisting of COCF and asset sales, as well as cash inflows per share.
Also, looking back at the past three MTMP periods, if we compare the average of the first four years (FY March 2018 to FY March 2021) with the average of the recent four years (FY March 2022 to FY March 2025), we have made a marked shift to a higher level of cash generation capability in recent years.
In addition, we have continuously made share repurchases since FY March 2014 and cancelled them without delay, realizing an increase in cash inflows per share (shown in the green line graph), achieving a CAGR of 11% over the past eight fiscal years.
Track Record of Profit and Earnings per Share (EPS)
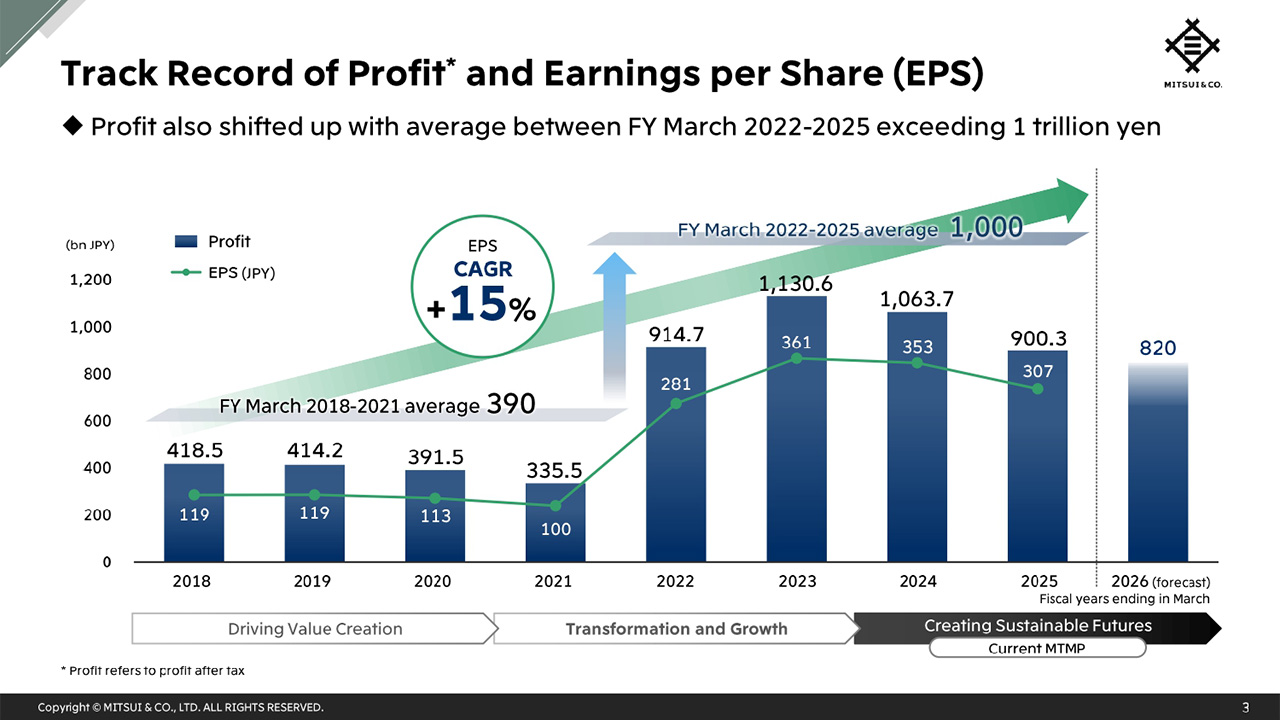
Regarding profit, there is a similar trend to cash inflows that can be seen in EPS. The average profit over the most recent four full-fiscal years exceeds 1 trillion yen, and EPS has grown at a CAGR of 15% over the past eight fiscal years. In the process of achieving this level of profit, in addition to initiatives for the steady enhancement of base profit, we have improved our integrated risk management functions in a business environment with increasing uncertainty. These experiences and sophisticated risk management will serve as a strong foundation supporting future growth.
Profit by Segment
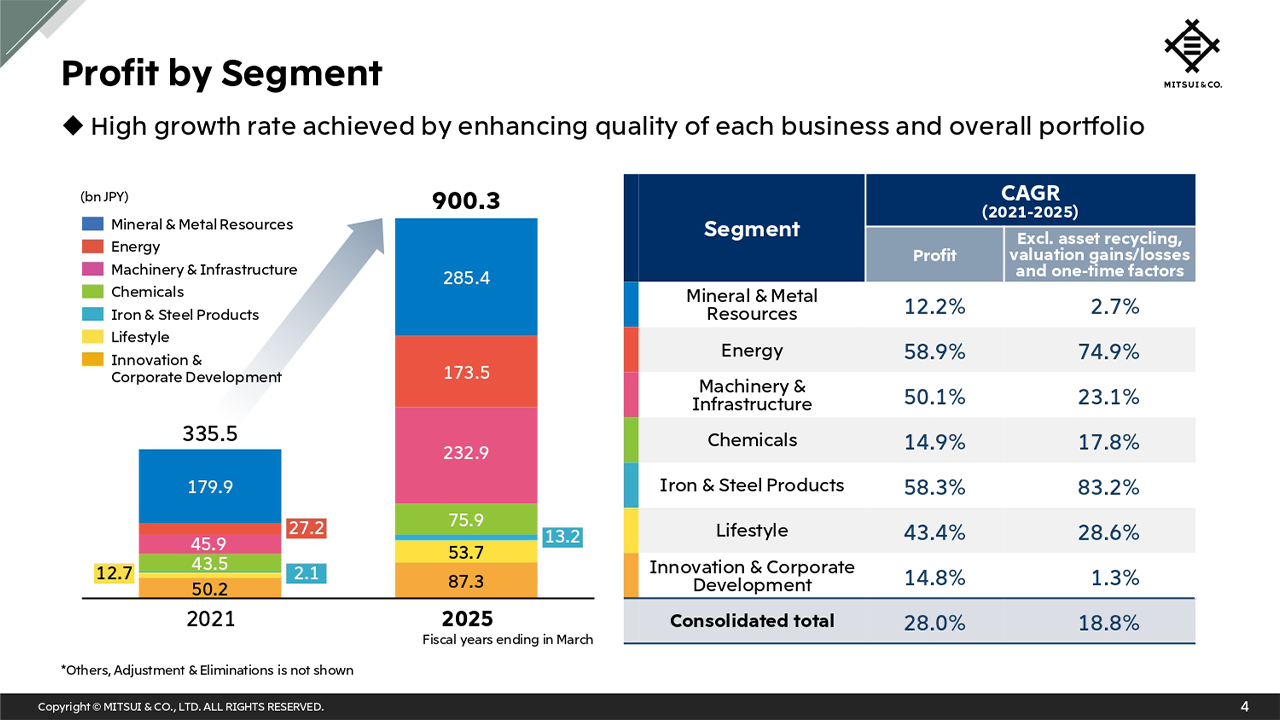
Next, I will speak on the change in profit by segment. The bar graph on the left shows profit by segment for FY March 2021 and FY March 2025, and the table on the right shows the CAGR for each segment during the same period. In addition to strengthening existing businesses through the thorough execution of our middle game initiatives, we are achieving high growth rates with sizable expansion of profit in the Machinery & Infrastructure segment, where we have executed strategic asset recycling, and in the Energy segment, which has a business portfolio that combines trading (such as LNG) and investments.
Recently, we made decisions on large-scale investments in projects such as Ruwais LNG , Blue Point low-carbon ammonia, and Rhodes Ridge iron ore. We are confident in our current unique portfolio, which has been built up by executing carefully selected investments for growth in line with our Key Strategic Initiatives, to make our strong businesses even stronger. Also, centered on the Portfolio Management Committee, on which the CSO and myself are members, we regularly review the portfolio balance in order to make continuous improvements.
ROIC by Segment (1/2)
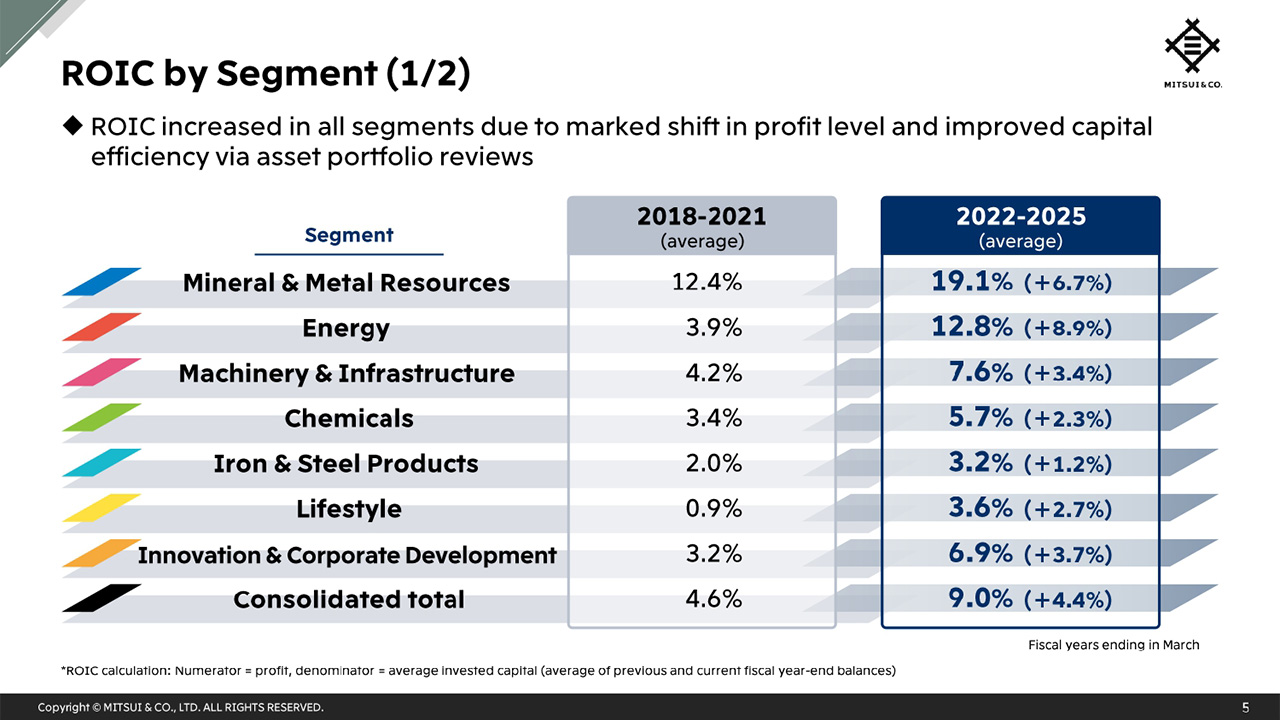
In addition to the level change in cash generation capability and profit, we also feel positive regarding the instilling of ROIC and its results, which has been a focus for us in our efforts to improve the ROE of the company. Here, we show the trend of ROIC by segment as a four-year average for the same periods as before.
ROIC in all segments has been improving due to the level change in profit through the enhancement of our businesses and capital efficiency improvements through asset portfolio reviews.
Given our portfolio spans a wide range of industries, simply comparing ROIC horizontally across segments is not necessarily appropriate, but we have worked on improving capital efficiency through historical comparisons and ROIC analysis by business area.
ROIC by Segment (2/2)
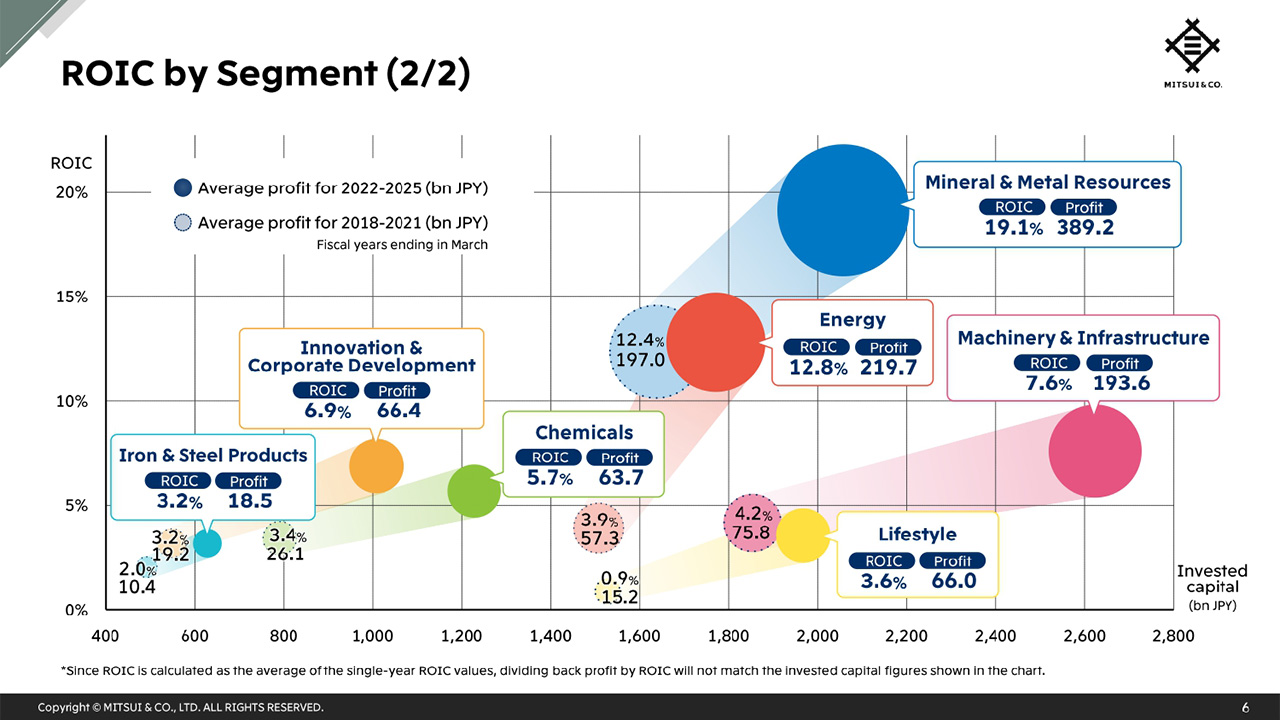
This bubble chart shows the ROIC shown earlier, along with the changes in profit and invested capital. The size of the bubbles correlates to profit, the vertical axis represents ROIC, and the horizontal axis represents invested capital.
As you can see, the bubbles for all segments have moved up and to the right; in other words, ROIC is improving while invested capital increases. Through the utilization of ROIC, a mindset has formed in which – when verifying the meaning of holding onto existing businesses – we carefully select businesses that will grow into core businesses in the future, and are mindful to select higher quality projects from a company-wide perspective when deciding on investments for growth. As a result, we believe that the initiative of utilizing ROIC by management and business operations has developed into a sustainable exercise.
ROIC by Segment
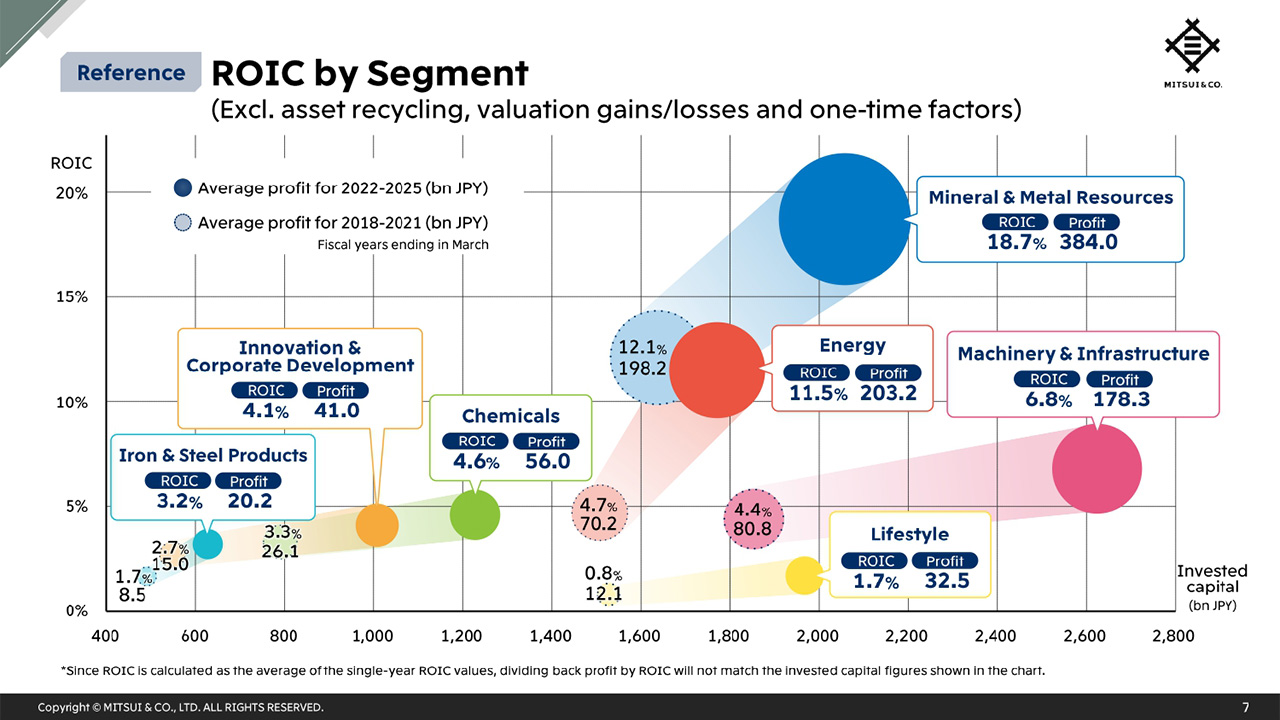
For your reference, ROIC calculated by excluding asset recycling and valuation gains/losses and one-time factors from the numerator (profit) shows a similar trend.
ROIC Enhancement in Lifestyle Segment
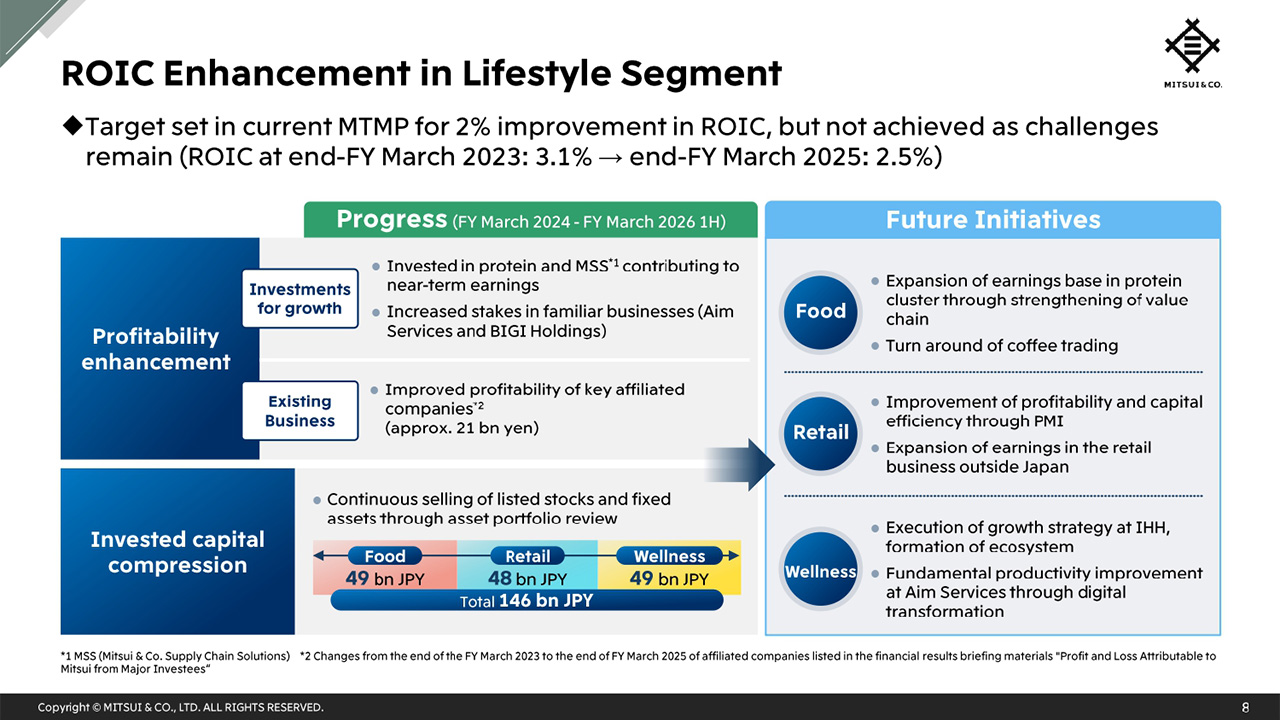
On the other hand, the introduction of ROIC has also highlights issues that need to be addressed. We set a target to improve the ROIC of the Lifestyle segment by approximately 2% during the current MTMP period. Although there was progress in the enhancement of base profit, reduction of working capital in trading, and reduction of invested capital through asset recycling, the target has not been achieved at this point.
Currently, the impact of the increase in invested capital due to investments for growth, such as the protein business and Aim Services, is significant. We aim to improve ROIC by achieving profit levels assumed at the time of deciding on these investments as soon as possible.
We will also continue asset recycling through the review of the business portfolio and work on further expanding the earnings contribution of investment for growth projects by pushing ahead with PMI. Specifically, in food, we will focus on expanding the earnings base in the protein business cluster by strengthening the value chain and the turnaround of coffee trading. In retail, we will focus on the steady execution of PMI and the expansion of earnings in the retail business outside Japan, including North America and Aisa. In wellness, in addition to the organic growth of IHH, we will focus on the formation of an ecosystem centered on IHH’s hospital business, and the enhancement of base profit through drastic productivity improvements at Aim Services such as through digital transformation.
Through the formulation and execution of action plans based on the analysis of each segment and business, we want to remain committed to ROIC improvement even beyond the current MTMP.
Track Record of Investments and Shareholder Returns
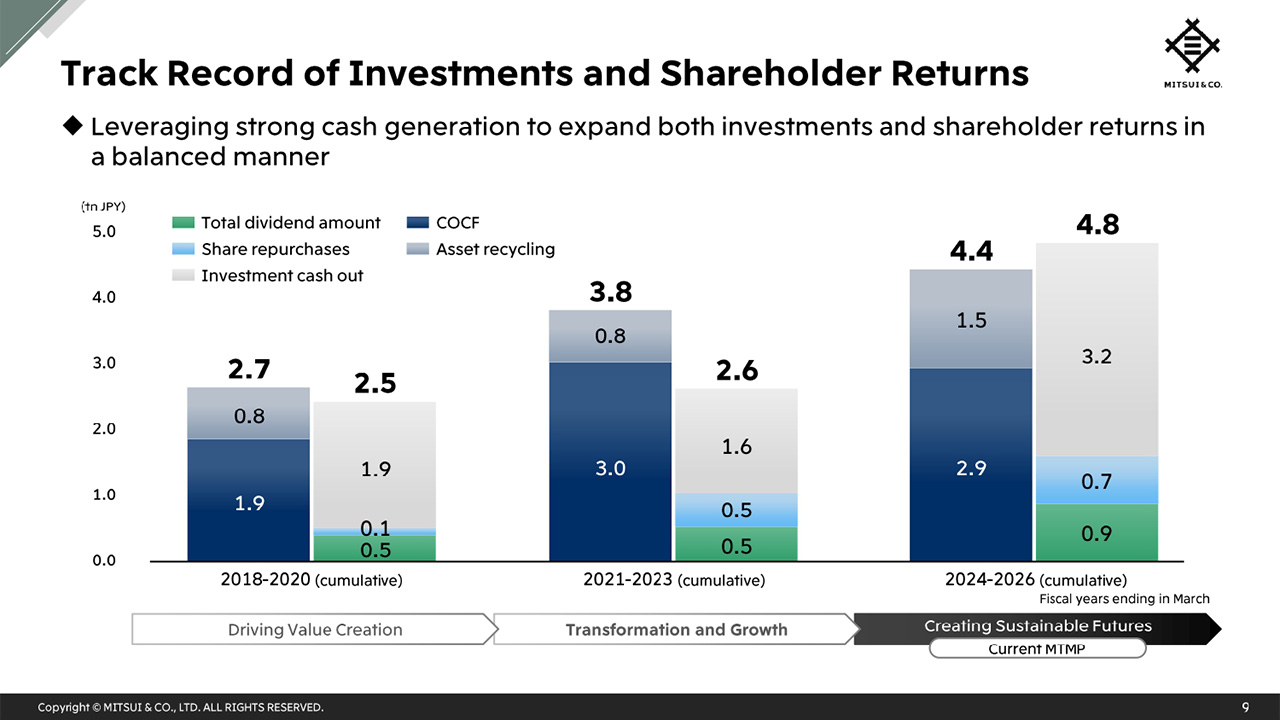
Here, we show the cash flow allocation, which is the basic framework supporting investments and the running of business operations.
By expanding the recurring part of our cash generation capabilities, and allocating funds from the Management Allocation which expanded as a result, we have increased investments for sustaining CAPEX and growth as well as shareholder returns, while being mindful of the balance. At the same time, we have maintained a strong financial base by continuing disciplined financial management. We will continue to work on the optimization of capital with a medium- to long-term perspective while maintaining this framework in the next MTMP.
Cash Flow Allocation During Current MTMP
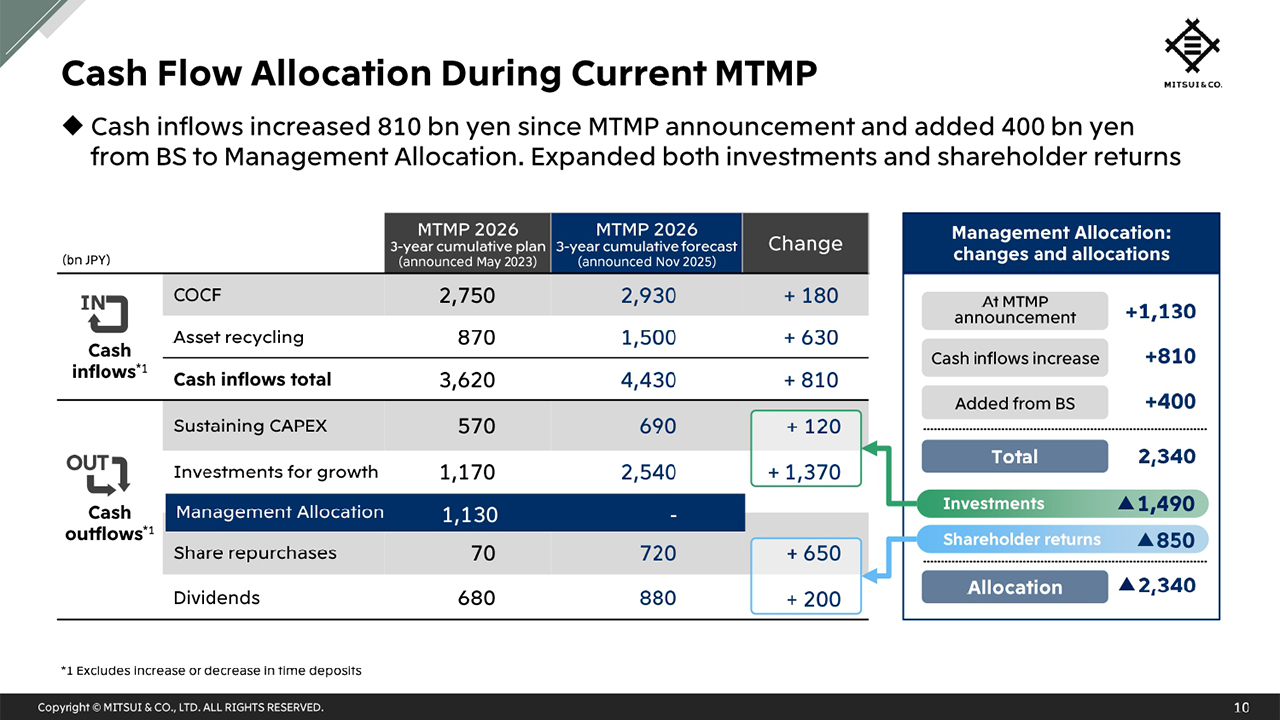
As a result of various initiatives, COCF is projected to increase from 2.75 trillion yen at the time of the current MTMP announcement to 2.93 trillion yen in the latest forecast, and asset recycling from 870 billion yen to 1.5 trillion yen, expanding the total cash inflows by 810 billion yen. In addition to this, for the acquisition of interests in the Australian Rhodes Ridge iron ore business, we have added 400 billion yen from the balance sheet to the Management Allocation, enabling us to achieve both carefully selected investments for growth and the expansion of shareholder returns.
Track Record of Dividend per Share
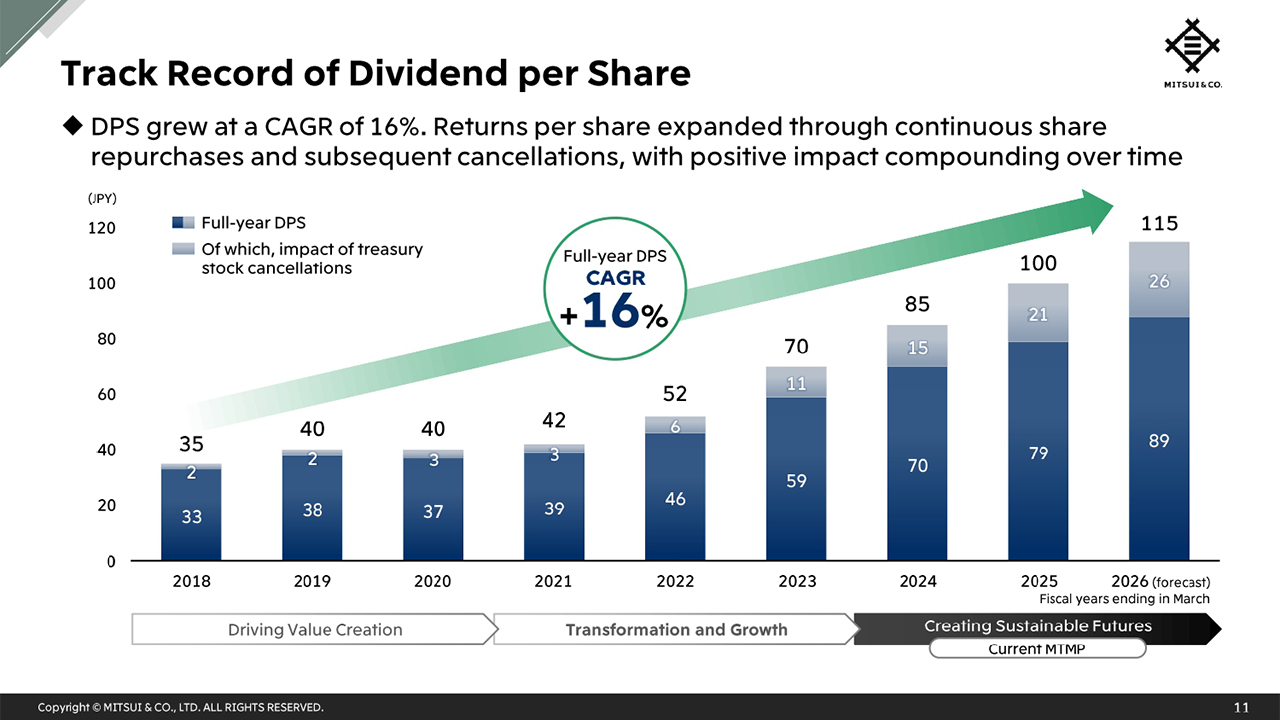
Finally, I will look back on shareholder returns.
Regarding dividends, the full-year DPS has grown at a CAGR of 16% since FY March 2018, and we have decided on a policy to continue progressive dividends beyond the end of the current MTMP.
Regarding share repurchases, we expect to have made a cumulative total of over 1.4 trillion yen since FY March 2014, including the currently ongoing share repurchase. Over the past 10 years, we have cancelled treasury stock acquired through repurchases equivalent to more than 20% of outstanding shares, thereby expanding per share returns. I think it is fair to say that around 20% of the current DPS derives from the effect of treasury stock cancellations. We will continue to enhance value per share and with it, enhance shareholder returns.
Conclusion
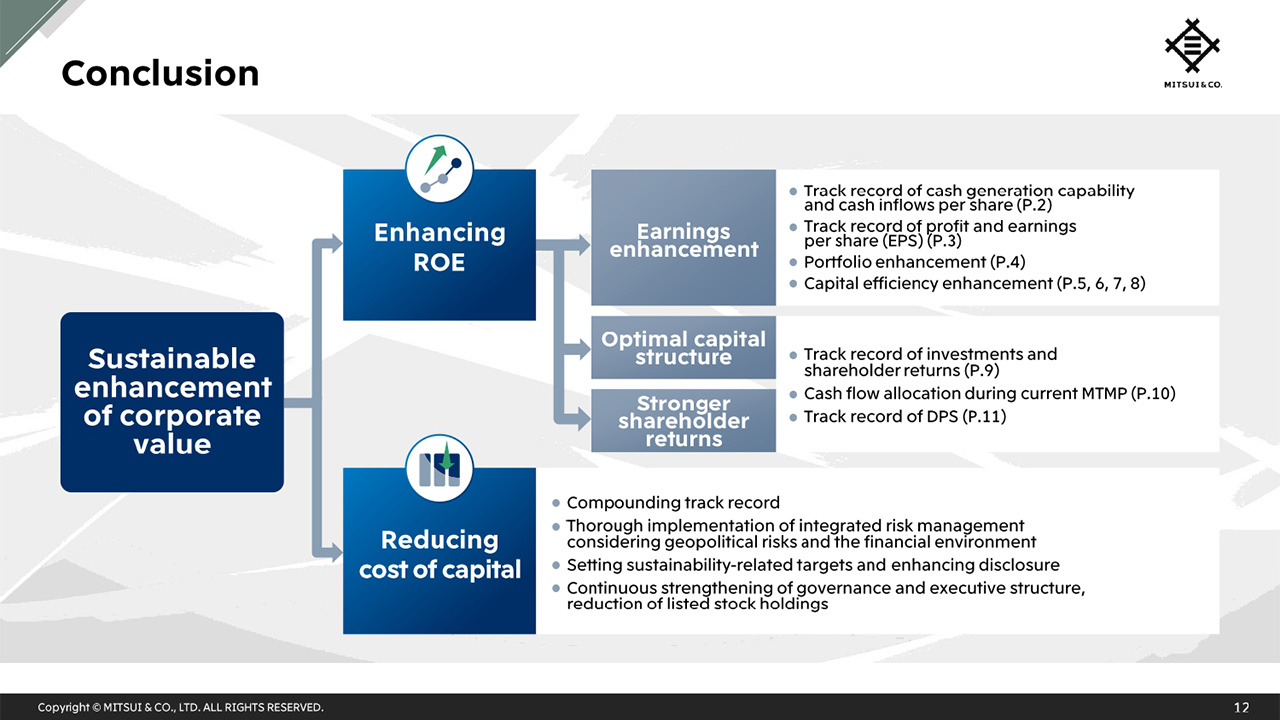
The enhancement of ROIC that I spoke about today is directly linked to the enhancement of ROE. There are only a little over three months left in the current MTMP period, but the whole company is working closely together to exceed as much as possible the quantitative target of over 12% on a three-year average.
Also, in addition to gaining trust by building a track record through middle game initiatives and strengthening downside resistance by acquiring and maintaining competitive assets and businesses, we will work to increase the spread between ROE against the cost of shareholder equity through efforts to lower the latter. To that end, we will continue to firmly provide feedback within the company regarding the advice and points raised in our dialogue with our stakeholders and utilize it to improve management decisions.
This concludes my presentation.
Q1:
Regarding the ROIC by segment. I believe the ROIC improvement in the Mineral & Metal Resources and Energy segments was partly due to the impact of commodity prices. Excluding the impact of commodity prices, please tell us what initiatives led to the improvement in ROIC in these segments.
Shigeta : We consider the Mineral & Metal Resources and Energy segments as areas of strength. We have been taking initiatives since the previous MTMPs to make these strong areas even stronger.
The Energy segment is particularly easy to understand; we offtake oil, natural gas, and LNG produced from interests and link them to trading. In trading, we have demonstrated layered functions such as logistics and financing functions, which are our strengths, as well as in market risk hedging. This is the result of pursuing the enhancement of profitability and business scale by combining logistics, trading, and investment in the E&P business and LNG business.
In the process of building up our track record, being approached by top-tier global partners and reliably realizing opportunities for further business expansion in existing projects have also led to the improvement of ROIC.
In the Mineral & Metal Resources segment as well, although the earnings contribution is yet to begin, we believe it is quite significant that we acquired a highly profitable business that can utilize existing infrastructure such as ports and railways, like with Rhodes Ridge, with partners with whom we have built relationships of trust over many years through the operation of joint ventures. We believe we have been able to make a strength of ours even stronger.
Q2:
Regarding the ROIC figures, you mentioned that the Lifestyle segment has challenges. I think the figure of 1.7 percent ROIC excluding one-time factors destroys corporate value, and I am concerned that you are investing more capital there than in the Energy segment. Furthermore, if the average ROIC of the segment is 1.7 percent, this implies that there are businesses with ROIC even lower than that.
Regarding the order of ROIC improvement, if you do not exit low ROIC assets before making new investments, assets will increase. In addition to improving unprofitable businesses such as coffee trading, I wonder if it is possible to improve ROIC by setting certain criteria and accelerating the replacement of unprofitable businesses.
Shigeta : We will thoroughly work on ROIC improvement in the Lifestyle segment. The Lifestyle segment has many traditional trading businesses, and the working capital included in invested capital is large in scale compared to other segments. We consider the risk of such businesses to be low, and we think it is somewhat unavoidable that the return is lower than the Mineral & Metal Resources and Energy segments. It is possible to break down segment ROIC into business areas, individual companies, or trading units, but this time we showed ROIC on a segment basis and explained where there is room for improvement and initiatives we are taking.
The ROIC we presented uses an average that paints a representative picture of each segment but in the current MTMP, there were challenges in coffee trading. Also, regarding the protein business, which we are convinced will grow into a good core business, there are projects that have not yet been able to contribute earnings as originally planned which is one of the factors for the low ROIC of the Lifestyle segment.
Q3:
Along with ROIC, I am paying attention to WACC and the spread between the two. I think the company-wide WACC exceeds 5 percent, so looking at figures excluding one-time factors, I think that in addition to the Lifestyle segment, the Chemicals, Innovation & Corporate Development, and Iron & Steel Products segments are also not exceeding the company-wide WACC. Please tell us if you are working on this while being conscious of the spread for each segment.
Also, since there are many long-term investments, I think there are cases where using IRR is more appropriate than ROIC. Please tell us how you are utilizing ROIC in terms of investment discipline in combination with other indicators such as IRR.
Shigeta : If we can present WACC by business area in the future, I think we can rationally explain the background regarding the differences in ROIC by business. On the other hand, since the industries and sectors that should be benchmarks differ on a business area or individual company basis, we believe that a simple average will not result in a convincing number. We will continuously consider what is the best way to present this going forward.
Also, if we set a standard based on the spread between ROIC and WACC common to the whole company, there are segments other than the Lifestyle segment that would be seen as having low capital efficiency, but it is necessary to take into account the industry, business area, and even region, so we have not set a uniform standard.
In reality, we benchmark with even more granularity than across the seven segments and 16 business units. We aim for an upward trend on a business unit and segment basis, but we make exceeding the WACC for each business area the first step, and we respond so as not to make rigid judgments.
IRR is an important indicator when judging profitability. We are also conscious of time until earnings contribution as an important element of portfolio diversification, and we utilize IRR in combination with profit after investment execution and ROIC trends.
Q4:
Regarding the Lifestyle segment, I think the situation is very different for each business and the fluctuation of earnings due to the external environment is also large. Please tell us how this segment will manage returns and assets, and take initiatives toward ROIC improvement.
Shigeta : In all of the Food, Retail, and Wellness business units that constitute the Lifestyle segment, I feel that core businesses where future growth can be expected have been developed in the previous and current MTMPs. If we grow the multiple core businesses that each business unit has gained confidence in, I think we can obtain returns that meet your expectations.
In the Chemicals business strategy presentation, there was an explanation about leveraging the functions of logistics and trading that are unique to Mitsui. Food also traditionally has strong trading, and by providing functions such as logistics, warehousing, and financing, we have constructed a highly reproducible earnings structure, in a way that is unique to Mitsui. Also, I think that new business collaborations and investment opportunities are born from logistics and trading with prominent partners, and these are growing into core businesses.
In the future initiatives section on slide 8, we show the direction toward further growth, and we will strive to achieve the numbers as planned through the accumulation of new investments made in the previous and current MTMPs to secure large returns.
As management, we are conscious of the appropriate allocation of funds and human resources to core businesses, and we ensure that the portfolio within the segment does not become excessively fragmented, and that differences do not arise with the business strategies of each business unit.
Q5:
Looking at slide 7, all segments have transitioned upwards and to the right, which is an improvement, but the Mineral & Metal Resources and Energy segments improved significantly, and it can be read that they drove the improvement of the company-wide ROIC. I do not think this is necessarily a bad thing, but I think the performance of both segments has a strong aspect of being affected by the external environment. Please tell us your thoughts on this point.
Shigeta : Regarding the bubble chart, I hope to show a diagram where each segment moves vertically upwards in the future. We believe there are certain differences in the level of ROIC that should be aimed for depending on the business area, but whether it is okay to invest capital in the same way across the board is a point that should be considered.
We sometimes receive comments regarding the volatility of the Mineral & Metal Resources and Energy segments, but making areas of strength even stronger does not simply mean that we increased the investment amount. While being conscious of the cost curve, we have acquired highly competitive interests and worked on the expansion of logistics and trading earnings and the reconfiguration and enhancement of the business portfolio. As a result, even in the bubble chart presented as an average so as not to be swayed by changes in the external environment of individual years, they are moving up to the top right. We are also proceeding with initiatives in energy transition, and we believe there is still room to raise the ROIC level in the medium- to long-term span.