Mitsui & Co. Global Strategic Studies Institute
Global Industry Trends and Growth Areas
Apr. 23, 2018
Yuko Noritake
Industrial Research Dept. II
Mitsui & Co. Global Strategic Studies Institute
Main Contents
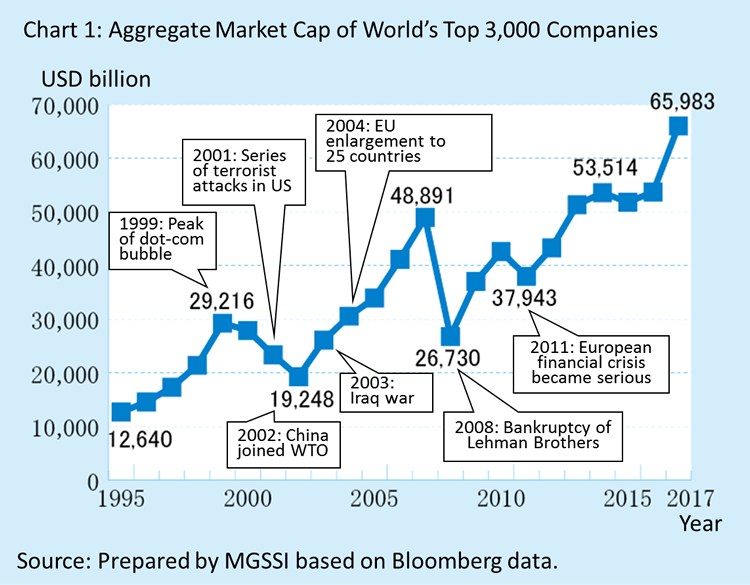
As shown in Chart 1, the aggregate market cap of the world’s top 3,000 companies in terms of market cap plunged at the time of the 2008 financial crisis but started to pick up in 2009. It has been on an uptrend since 2012 and reached about USD 66 trillion in 2017. However, the degree of growth significantly varies from industry to industry, apparently reflecting the operating environment of each industry and expectations for future earnings. In this report, we classify the leading global firms into groups, look at changes in the market cap by group, and grasp new trends in industries1.
Changes in Market Cap by Group
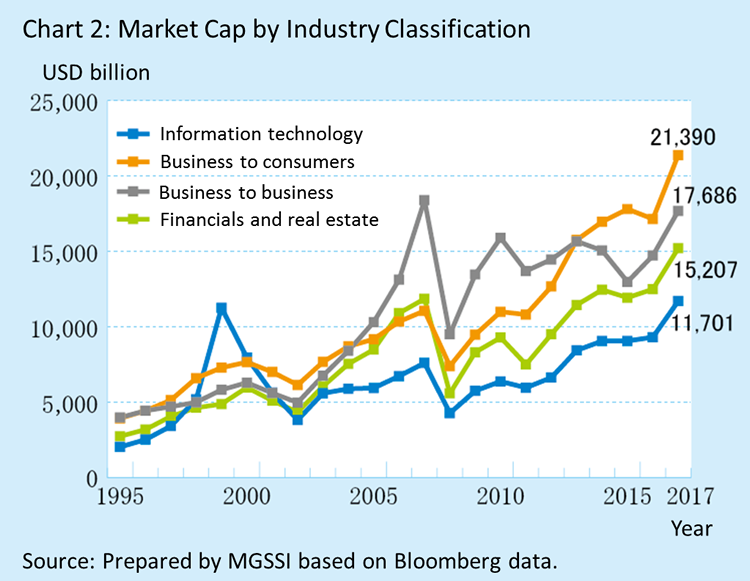
The market cap of the top 3,000 companies jumped 1.7-fold on an aggregate basis in the period between the end of 2011 (when it entered a new growth trajectory after the post-financial crisis) and the end of 2017. We classified the top 3,000 companies into four groups2: (1) information technology (software, services, devices, infrastructure); (2) business to consumers (consumer products, retail, services for consumers); (3) business to business (basic materials, capital goods, resources, services for companies); and (4) financials and real estate.
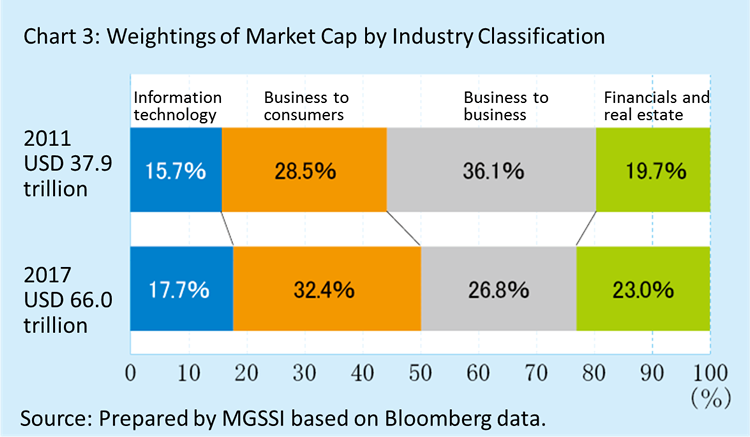
As shown in Chart 2, the market cap of groups (1), (2), and (4) expanded 2.0-fold in the period between the end of 2011 and the end of 2017, outpacing the overall growth. In contrast, the market cap of (3) was up only 1.3-fold, which was significantly below the overall growth. During the same period, the weighting of (3) in the total market cap of the four groups also decreased 9.3 points. Meanwhile, that of (2) rose 3.9 points, highlighting the increasing presence of the business to consumers group in all industries (Chart 3).
The market cap of a company can be broken down into two factors: its current earnings power; and prospects for future earnings (including concerns). For the latter, the price-to-earnings ratio, or the P/E multiple (market cap divided by earnings), is a simple and widely used indicator. However, the multiple sometimes expands on expectations for a recovery when a company reported a profit decline due to one-off drags. In order to simply look at expectations for future growth, we calculate the 2017 P/E in this report by dividing the market cap as of end-2017 by the largest annual net income reported in the period between 2011 and 2017. We also note that, in some cases, the market cap has incorporated excessive expectations for the future, which can be seen as a bubble. However, the market cap is the valuation of a company based on analysis and decision making by a large number of market participants, and it is meaningful to monitor the trend. We believe that even if investors’ expectations are affected by overall market sentiment, the market cap is an efficient tool to compare different groups or compare each group with the overall market.
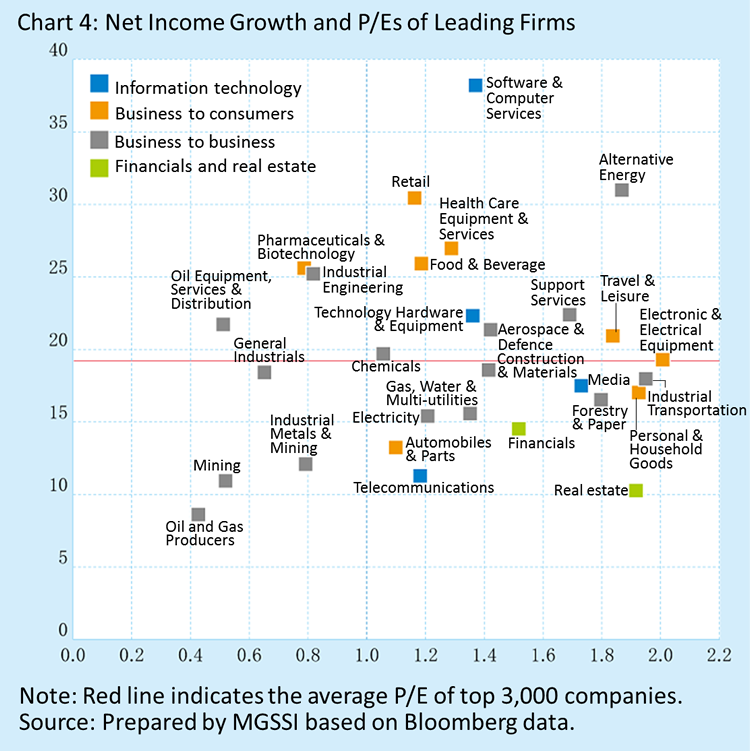
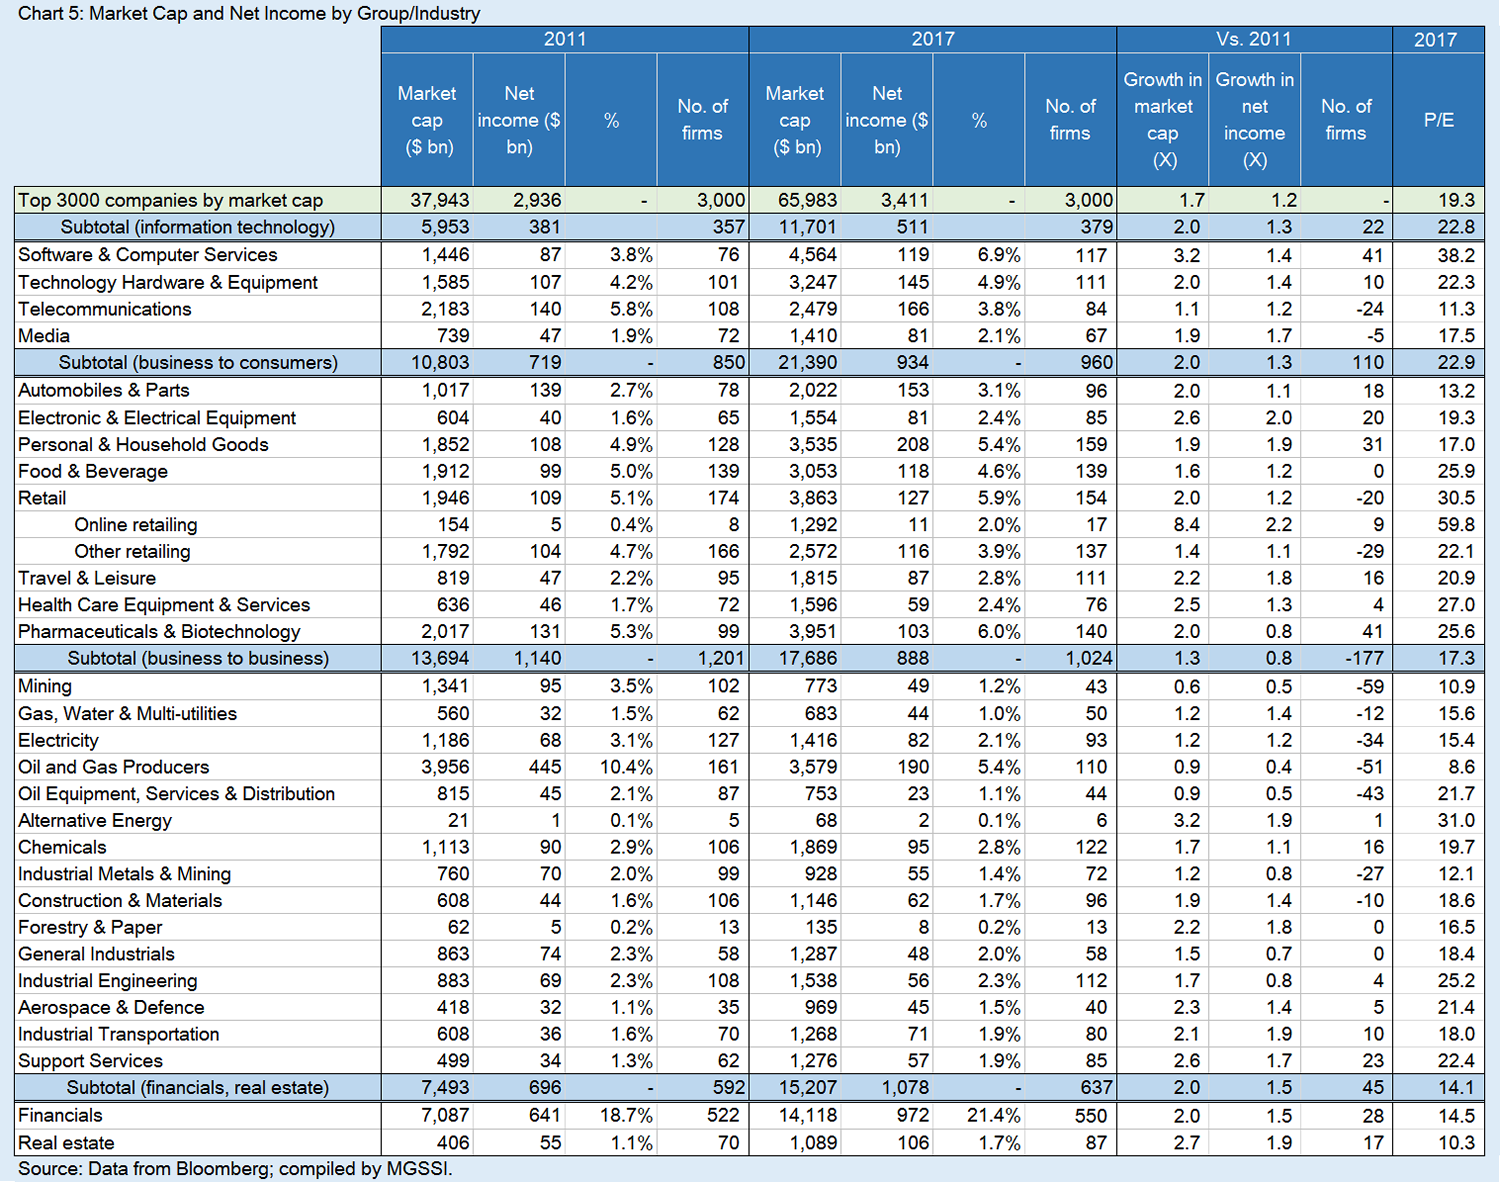
In Chart 4, we plot each industry’s net income growth in 2011-17 on the horizontal axis and the P/E in 2017 on the vertical axis (refer to Chart 5 for detailed data). There is a positive, albeit weak, correlation between two variables, suggesting that earnings in the past affect expectations for future growth.
Among all industries, expectations for growth are the highest for “Software & Computer Services,” which includes four out of the top ten global companies by market cap, namely Alphabet (ranked second), Microsoft (third), Facebook (fifth), and Tencent (sixth). The industry saw total net income and total market cap surge 1.4-fold and 3.2-fold, respectively, from 2011 to 2017, and its P/E in 2017 was remarkably high at 38.2X. Of note, these trends are not limited to top-ranking firms. Even excluding the abovementioned four companies, the market cap jumped 2.2-fold and the P/E was 31.6X. “Technology Hardware & Equipment,” another industry in the information technology group, includes Apple, the most valuable company in the world at end-2017. This industry saw its total net income and market cap advance 1.4-fold and 2.0-fold, and its P/E was 22.3X, surpassing the average of all industries. Meanwhile, net income and market cap of “Telecommunications” grew only 1.2-fold and 1.1-fold, and the P/E was low at 11.3X. The information technology group overall enjoyed a 1.3-fold increase in net income and 2.0-fold growth in the market cap, and the P/E was 22.8X. All of these were above the average of all industries.
“Business to consumers” group can be divided into two subgroups – (1) industries with low net income growth and a high P/E, such as “Retail” and “Health Care Equipment & Services,” and (2) those with high net income growth and a P/E on par with the average of all industries, such as “Electronic & Electrical Equipment” and “Personal & Household Goods.” For the business to consumers group overall, the market cap grew at a faster pace than net income (up 2.0-fold for the former vs. up 1.3-fold for the latter), indicating mounting expectations for future growth. The P/E of 22.9X was also above the average of all industries.
Many “business to business” group saw net income drop from 2011 to 2017. “Oil & Gas Producers” and “Mining” particularly suffered a sharp profit decline, and their P/E were low at 8.6X and 10.9X. The group’s market cap previously surged as their operations expanded on the back of globalization and rising resource prices from 2002, but it has leveled off since 2010, after the financial crisis.
Meanwhile, “Financials” and “Real Estate” enjoyed robust net income growth, but their P/Es were low (in the range of 10-15X). This suggests investors’ low expectations for future growth. The market cap of the group rose 2.0-fold in the period between end-2011 and end-2017, helped by profitability improvement. In “Financials,” the consumer finance industry, which consists of payment service providers Visa and MasterCard as well as consumer lending companies, saw the market cap jump 2.7-fold although net income only grew 1.3-fold. The P/E of 23.9X was above the average of all industries, probably because the consumer finance industry has some aspects of the business to consumers group.
Bushiness to Consumers Group
The business to consumers group have been increasing their presence in recent years. In “Retail,” which has direct connections with consumers, the market cap surged 2.0-fold while net income grew only 1.2-fold in 2011-17. Online retailers, such as Amazon, Alibaba, Netflix (online streaming provider), and JD.com, particularly showed strong growth. Their market cap jumped 8.4-fold and the P/E reached 59.8X. Such high valuations apparently reflected their growth potential. Meanwhile, other retailers, which mainly operate brick-and-mortar stores, saw the market cap rise only 1.4-fold. Their P/E of 22.1X was relatively low among the business to consumers group. Walmart, the world’s largest retail corporation, is no exception. Its market cap grew a moderate 1.4-fold between 2011 and 2017, and the P/E in 2017 was 17.2X, which was below the average of brick-and-mortar store operators. Similarly, Seven & i Holdings’ P/E of 20.9X and its 1.5-fold growth in the market cap were relatively low among the business to consumers group.
Compared to such conventional retailers, consumer products makers generally made a good showing. “Electronic & Electrical Equipment” posted a strong 2.6-fold rise in the market cap vs. two-fold net income growth. “Personal & Household Goods” also saw net income and the market cap advance 1.9-fold. In “Personal & Household Goods,” toy manufacturers (mainly game makers, such as Nintendo, Activision Blizzard, Electronic Arts) deserve attention, as their market cap surged 2.7-fold vs. a moderate 1.2-fold growth in net income, and the P/E was a high 54.6X. These valuations suggest higher expectations for future growth.
As previously mentioned, expectations are generally low for retailers that mainly operate brick-and-mortar stores. However, some SPAs (Specialty store retailer of Private label Apparel; a fashion company involved at all stages of the value chain from design and production to retail sales), such as Inditex (mainstay brand Zara), Fast Retailing (Uniqlo), and Nitori Holdings, saw their market cap jump 2.1-fold, 2.2-fold, and 3.0-fold, respectively, in the same period. The P/Es of these firms were around 30X, showing strong expectations for growth.
Meanwhile, “Automobiles & Parts” saw net income rise only 1.1-fold. While the industry’s 2.0-fold growth in the market cap outpaced the average of all industries, the P/E was 13.2X, extremely low among the business to consumers group. Even if we look at the P/E of leading automakers, Toyota Motor was only 10.5X, and Volkswagen, Daimler, and BMW were below 10X. These valuations seem to have factored in a growing sense of uncertainty about the industry’s future, amid changes in the operating environment, such as a shift to EVs in many countries and a wider use of car-sharing services.
Growing Expectations for Medical and Healthcare-Related Industries
Among the business to consumers group, expectations for future growth are particularly high for medical and healthcare-related industries. “Health Care Equipment & Services,” in which US companies rank high, saw net income and market cap grow 1.3-fold and 2.5-fold from 2011 to 2017, and the P/E in 2017 was high at 27.0X. For “Pharmaceuticals & Biotechnology,” the market cap advanced 2.0-fold despite a decline in net income (to 80% of the 2011 level), and the P/E was a high 25.6X.
Consumer goods and cosmetics manufacturers, such as Unilever, L'Oréal, and Estée Lauder Companies, are included in “Personal & Household Goods,” which also covers apparel, daily goods, leisure items, and furniture manufacturers. As of end-2017, 29 consumer goods and cosmetics manufacturers were ranked among the top 3,000 companies. Their net income and market cap jumped 2.1-fold and 2.0-fold from 2011 to 2017. The valuations for Japanese cosmetics companies, such as Shiseido, Kose, and Pola Orbis Holdings, have particularly expanded, as their sales are growing in Asia where consumers highly value the safety of their cosmetics products. Of note, the growth in the market cap was larger than that in net income, and the average P/E of the three Japanese firms, which were ranked among the top 3,000 companies as of end-2017, was an elevated 57.1X. The same thing applies to daily necessities manufacturers, such as Kao and Unicharm, and the average P/E of the four Japanese firms was 28.7X. Meanwhile, sporting goods manufacturers, such as Nike, Adidas, VF (mainstay brand “The North Face”), have also attracted investors’ attention, as (1) people have become more health-conscious and the number of people playing sports is increasing and (2) growth potential of health-related areas is highly valued. The market cap of the eight sporting goods manufacturers that are ranked among the top 3,000 companies increased 2.3-fold in the period between 2011 and 2017. The P/E was also high at 30.0X.
In recent years, “Food & Beverage” manufacturers have enjoyed growth in products with health benefits. Their market cap grew a robust 1.6-fold while net income increased 1.2-fold. The P/E of the industry was high at 25.9X, although profits have been on a downtrend at many companies, including Nestlé and The Coca-Cola Company. Looking at the figures of each company, we note that some companies, such as functional foods & drink manufacturers (such as Monster Beverage Corporation, Kerry Group, and Yakult Honsha) and dairy product makers in emerging countries (Inner Mongolia Yili Industrial Group, Vinamilk), boosted the overall P/E. The valuations of major players in the industry, including Nestlé, are low at this juncture. However, they have stepped up their M&A efforts in response to growing needs for health-conscious products mainly in advanced countries. How investors assess such deals will be reflected in the market cap going forward.
As described above, medical and healthcare-related companies warrant attention, as they are expected to enjoy robust growth. With such companies being included in various industries, we need to analyze global trends across industries and more closely, in order to find areas with growth potential.
- Market cap and earnings based on Bloomberg data.
- Author’s classification in reference to Industry Classification Benchmark (ICB), which is widely used by global stock exchanges.