Mitsui & Co. Global Strategic Studies Institute
The Future of Global Meat Demand -- Implications for the Grain Market
Sep. 9, 2016
Yukiko Nozaki
Industrial Studies Dept. II, Mitsui Global Strategic Studies Institute
Main Contents
In the 2000s, the growing demand for meat pushed up the demand for feed grain. This was one factor behind the rise in the prices of soft commodities, and has also led to an upsurge in investment in agriculture. However, this growth in the demand for meat is said to be a consequence of economic development in emerging markets. While the recent slowdown in China and other emerging economies continues, how meat demand fluctuates in the future is worthy of attention.
Economic development and meat consumption
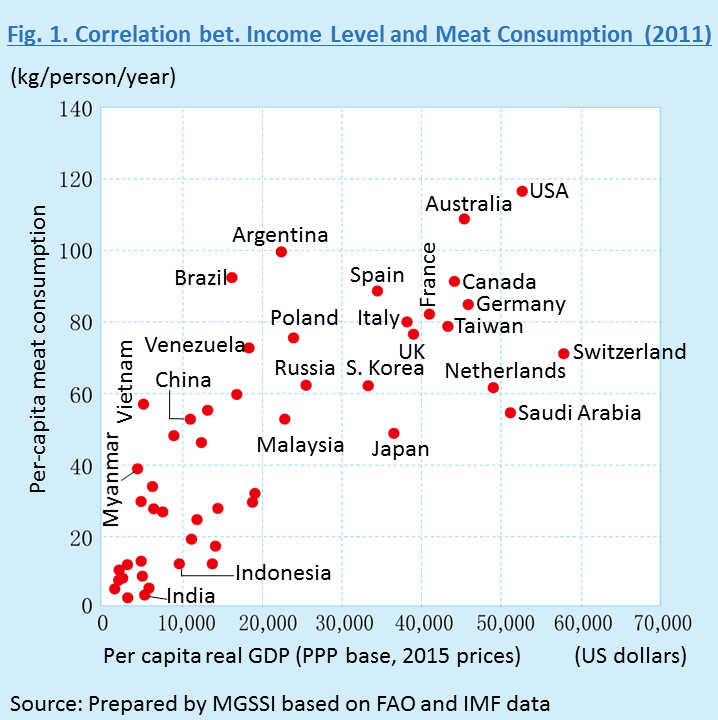
There is a positive correlation between income level and meat consumption. Figures 1 and 2 show the relationship between per capita real GDP and per capita meat consumption based on 2011statistics, which is the most recent data available for the countries shown. The figures show that the lower the income level of a country, the lower the meat consumption, the higher the income level, the higher the meat consumption. Looking at the changes over time by country also reveals that, in most countries, the per capita consumption of meat increases along with the rise in per capita real GDP. It seems likely that this relationship arises because meat is not an essential product like grains, which are used as a food staple, and its consumption is easily influenced by income level. Accordingly, global meat consumption in the 2000s increased sharply along with the acceleration of economic growth, which occurred mainly in the emerging economies, rising from 209 million tons in 2000 to 270 million tons in 2011, an increase of 1.3 times, outstripping the growth in the world’s population, which increased by 1.1 times during the same period. Since per capita meat consumption is also likely to grow in countries where it is currently at a low level if incomes in those countries rise in future, there is still plenty of scope for further expansion.
However, if we look at the situation in each country over time, although the actual timing and level differ by country, in most high-income countries and some middle-income countries, the increase in per capita meat consumption is more or less levelled off. As a typical example, the per-capita meat consumption in most European countries, including the middle-income countries of Eastern Europe, remains on the same level at between 70kg and 90kg. Moreover, in Taiwan, even though it is located in Asia, where food culture differs significantly from that of western countries, per-capita meat consumption has been moving sideways after reaching the same level as that seen in Europe (80kg). Looking at other Asian countries, although meat consumption has not currently reached that level in South Korea and China, it continues to rise and will very likely grow to the same level as Taiwan and Europe in future.
Meanwhile, meat consumption in Japan has stabilized at slightly under 50kg, an exceptionally low level compared to other countries. One reason for this could be the fact that Japanese consume a lot of seafood as a source of protein. However, per capita seafood consumption is actually higher in South Korea than it is in Japan, even though South Koreans also eat a lot of meat. In light of this, it appears that the difference cannot be explained by the consumption of seafood alone.
Conversely, there are countries where meat consumption is significantly higher than in Europe and Asia. Typical examples are the USA, where per-capita consumption has stabilized at about 120kg, and Australia, where the present level of consumption is in excess of 100kg and still rising slowly. Per capita meat consumption is also continuing to rise in Argentina, where it currently stands at close to 100kg, and Brazil, where it is currently above 90kg. It is assumed that the reason meat consumption is high in these countries is because the price of meat is held down by the low cost of producing beef, which is possible because of the extensive land area available for grazing, and beef certainly accounts for a higher percentage of the meat eaten in each of these countries compared to other countries.
In countries where meat consumption continues to grow, the degree of correlation between income and meat consumption differs by country. If we look at the elasticity of per-capita meat consumption growth in relation to income growth taking Myanmar and Vietnam as examples, the elasticity for these two countries from 2006 to 2011 was 1.8 and 1.7, respectively, and meat consumption growth was seen to be higher than income growth. Per capita meat consumption during that period, increased from 24kg to 39kg in Myanmar and from 38kg to 57kg in Vietnam. In Indonesia, where there is also the element of a religious taboo against eating pork, although the per-capita meat consumption level was relatively low at 12kg in 2011, the elasticity during the period from 2006 to 2011 was 0.8, and meat consumption growth was close to that of income growth. In contrast, elasticity in the same period in India, which has approximately the same income level as Vietnam, was 0.02, and per-capita meat consumption currently remains at a low level of only 3.4kg. While religious restrictions on the consumption of beef can be considered to be a reason for the low level of meat consumption in India, because the level of consumption of meat other than beef is also low, religious constraints do not appear to be the sole reason. The possibility that meat consumption will start growing significantly in India as well in the future, despite the current trend, cannot be ruled out, and we should keep an eye on future trends in meat consumption in countries with large populations such as India and Indonesia.
Estimating meat demand up to 2050

As has been explained, there is a positive correlation between income and meat consumption, but there is also a rule whereby per-capita meat consumption peaks at a certain level. Bearing that in mind, it should be possible to predict future global meat demand by using each country’s population and GDP forecasts. In specific terms, with the upper limit of per-capita meat consumption for each country being set, by multiplying the predicted rate of increase in per-capita real GDP for each country by the income elasticity of meat consumption, we can calculate the meat consumption for each country up to 2050, and combine these to calculate global meat demand. We derived the following estimates based on this framework, taking the upper limit of consumption as 120kg in the USA and Australia and 80kg elsewhere, and using the actual elasticity coefficients for each country for the five-year period up to 2011.
The calculations are such that because the elasticity is low in countries where meat consumption has already levelled off, consumption in those countries will remain at the same level up to 2050, whereas in countries where meat consumption is still rising, it will increase at approximately the same pace as now until it reaches the upper limit. For the population predictions, we have used the UN estimates, and for the GDP forecasts we used our original estimate1 based on the relationship between income level and GDP growth rate.
According to the results of the calculations, global meat consumption will reach 388 million tons in 2030, 1.44 times the 2011 figure, and 460 million tons in 2050, 1.71 times the 2011 figure, which means that although its growth rate will slow down slightly, consumption of meat will continue to grow. However, because we used the actual elasticity coefficients, which in India’s case is a very low 0.02, the level of meat consumption predicted for India in 2050 by these calculations changes little from the current figure of 3.4kg. Given that India will have a substantial effect on any such calculations because of its huge population, we need to construct a scenario in which meat consumption increases in India. Therefore, as the GDP estimates used for these calculations predict that India will have a per-capita real GDP of about $25,000 in 2050, we set India’s per-capita meat consumption in 2050 at 34kg, which was the level of meat consumption in Japan in the 1980s, when Japan had an equivalent income level. As a result, India’s meat consumption in 2050 becomes 58 million tons. Although a per-capita meat consumption of 34kg is by no means high in global terms, it raises India to second place behind China in terms of total meat consumption due to its large population, and under this scenario, global meat consumption will rise to 512 million tons in 2050, 1.91 times its current level.used for feed. If we simply assume that the volume of that feed increases at the same pace as meat demand, on the premise that there is no change in the current level of feed efficiency, and that the remaining portion of the wheat and corn increases in proportion to the growth in global population because the bulk of that remainder is used for food, we calculate that in 2050, the world will need 1.52 times the amount of wheat and corn grown today, rising to 1.59 times in the scenario in which meat consumption increases in India (Figure 3).
That said, because the world has limited space for increasing the area of land used for cultivation, it will be necessary to increase agricultural output per hectare (crop yield) by 1.52 times or 1.59 times to achieve the required production volume by 2050. Suppose the crop yield growth rate achieved in the 2000s (1.55%) were to continue until 2050, we calculate that the crop yield would increase by 1.82 times and the required production volume could be guaranteed. However, the crop yield growth rate has recently been sluggish, and it will be difficult to maintain that level of growth in future. This is because, in the past, the introduction of irrigation and chemical fertilizers contributed to dramatic increases in crop yield, but now that such measures have become widespread, it will be difficult to increase crop yields further. There are also other factors, such as climate change, putting downward pressure on agricultural production, and there are concerns that crop yield growth may slow further in future. According to the latest agricultural outlook issued jointly by the OECD and the FAO, wheat yields are projected to rise at a rate of 0.9% annually up to 2025 and corn yields are projected to grow by 1.0% annually during the same period. If crop yields grow at a rate of 1% up to 2050, they will rise only to 1.47 times the current level, and even if there is no future growth in meat consumption in India, the yield will fall short of the required volume, and this will put upward pressure on the price of both grain and meat.
Since an increase in price will lead to improved profitability in agricultural production and related sectors, it is likely to stimulate developments in peripheral technology in the agricultural sector, and particularly in areas such as breeding of seed varieties for the purpose of increasing grain crop yields, and animal nutrition such as feed formulation and additives for improving feed efficiency. In addition, it would make farmers more willing to produce and provide opportunities for the diffusion of these advanced technologies. As a result, we can expect more business opportunities to be created than before in sectors supporting the expansion of meat supplies.
The grain market is the key

If meat demand rises to this extent, it will have a significant impact on the supply and demand of grain by pushing up the demand for the feed grain required for meat production. Currently, 40% of the world’s wheat and corn is
- Explanation of the GDP estimates used in this report
- Based on historical performance, per-capita GDP growth in low income countries has customarily increased at a faster pace than in middle and high income countries. Since the 2000s, in particular, the increase has been greater in the vast majority of low income countries and in many middle income countries than in the high income countries. Moreover, growth in the middle and low income countries in Asia has continued to outstrip that in other parts of the world.
- In light of this situation, we divided the countries of the world into the following five categories: high income countries (per-capita GDP of $25,000 or more at 2015 prices), Asian middle income countries (per-capita GDP of $10,000 or more and less than $25,000 at 2015 prices), Asian low income countries (per-capita GDP of less than $10,000 at 2015 prices), other middle income countries, and other low income countries. We assumed the annual per-capita GDP growth rate to be 1.0% for high income countries, in line with recent performance, 4.0% for Asian middle income countries, 1.5% for other middle income countries, which is a little above the rate for high income countries, 5.0% for Asian low income countries, the same as the recent rate, and 3.0% for other low income countries, which is the rate achieved in Sub-Saharan Africa.
- When the per-capita GDP of a low or middle income country has entered the range of that of a middle or high income country as a result of growth, we have applied the assumptions for the new category to that country.